The FrequencySeries class
While gravitational-wave detectors are time-domain instruments, their sensitivity is frequency dependent and so is often measured as a power-spectral-density over the range of interesting gravitational-wave frequencies (~10-10,000 Hz). Additionally, the auxiliary channels used to sense and control instrumental operations each have their own frequency-domain characteristics, contributing to the overall sensitivity spectrum.
The FrequencySeries object is used to represent any frequency series, including the power-spectral (and amplitude-spectral) density series describing instrument performance.
Analogously to the TimeSeries, a new FrequencySeries can be generated from any data sequence along with the minimal f0 and df metadata:
>>> from gwpy.frequencyseries import FrequencySeries
>>> spec = FrequencySeries([1,2,3,4,5,6,7,8,9,10], f0=0, df=1)
>>> print(spec)
FrequencySeries([ 1  2  3  4  5  6  7  8  9 10],
                name: None,
                unit: None,
                epoch: None,
                channel: None,
                f0: 0 Hz,
                df: 1 Hz,
                logf: False)
The full set of metadata that can be provided is as follows:
Name for this data set. |
|
The physical unit of these data. |
|
GPS epoch associated with these data. |
|
Starting frequency for this |
|
Frequency spacing of this |
Generating a FrequencySeries from a TimeSeries
The frequency-spectrum of a TimeSeries can be calculated using either of the following methods:
Calculate the PSD |
|
Calculate the ASD |
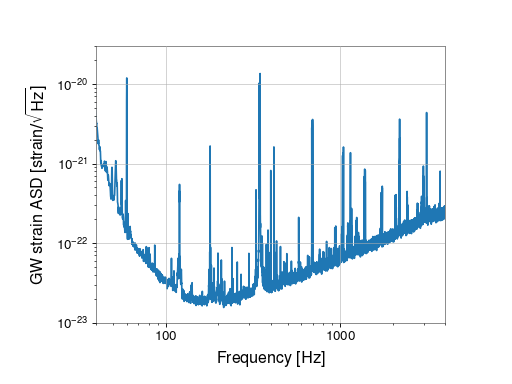
In this example we expand upon plotting a TimeSeries, by calculating the amplitude-spectral density of the gravitational-wave strain data from LHO:
>>> from gwpy.timeseries import TimeSeries
>>> gwdata = TimeSeries.fetch_open_data(
...     "H1",
...     "Sep 14 2015 09:45",
...     "Sep 14 2015 09:55",
... )
>>> spectrum = gwdata.asd(8, 4)
where the result is an average spectrum calculated using the Welch method.
Reading/writing frequency-domain data
Plotting a FrequencySeries
Similarly to the TimeSeries, the FrequencySeries object comes with its own plot() method, which will quickly construct a Plot:
>>> plot = spectrum.plot()
>>> ax = plot.gca()
>>> ax.set_xlim(10, 2000)
>>> ax.set_ylabel(r'GW strain ASD [strain$/\sqrt{\mathrm{Hz}}$]')
>>> ax.set_ylim(5e-24, 1e-20)
>>> plot.show()
(png)

FrequencySeries applications
FrequencySeries reference
|
A data array holding some metadata to represent a frequency series. |
|
A 2-dimensional array containing the variance histogram of a frequency-series |