Note
Go to the end to download the full example code.
Comparing seismic trends between LIGO sites
On Jan 16 2020 there was a series of earthquakes, that should have had an impact on LIGO operations, I’d like to find out.
Data access
We choose to look at the 0.03Hz-1Hz ground motion band-limited RMS channel (1-second average trends) for each interferometer. We use a format string so we can substitute the interferometer prefix without duplicating the channel name:
channel = "{ifo}:ISI-GND_STS_ITMY_Z_BLRMS_30M_100M"
lhochan = channel.format(ifo="H1")
llochan = channel.format(ifo="L1")
To access the data, we can use get(), and give start and end
datetimes to fetch 6 hours of data for each interferometer:
from gwpy.timeseries import TimeSeriesDict
data = TimeSeriesDict.get(
    [lhochan, llochan],
    "Jan 16 2020 8:00",
    "Jan 16 2020 14:00",
    host="nds.gwosc.org",
)
/home/duncan.macleod/gwpy-nightly-build/conda/envs/gwpy-nightly-3.11/lib/python3.11/site-packages/igwn_auth_utils/requests.py:56: DeprecationWarning: Support for identity-based X.509 credentials for LIGO.ORG is being dropped.
Calls to this utility will stop working on/around 20 May 2025.

For details on this change please see

https://computing.docs.ligo.org/guide/compsoft/roadmap/LVK/x509_retirement/

If you have questions about this message, or its implications, please
consider opening an IGWN Computing Help Desk ticket:

https://git.ligo.org/computing/helpdesk/-/issues/new
  return func(*args, **kwargs)
Visualisation
Now that we have the data, we can easily plot them:
plot = data[lhochan].plot(
    color="gwpy:ligo-hanford",
    label="LIGO-Hanford",
    yscale="log",
    ylabel=r"$1-3$\,Hz motion [nm/s]",
)
ax = plot.gca()
ax.plot(data[llochan], color="gwpy:ligo-livingston", label="LIGO-Livingston")
ax.set_title("Impact of earthquakes on LIGO")
ax.legend()
plot.show()
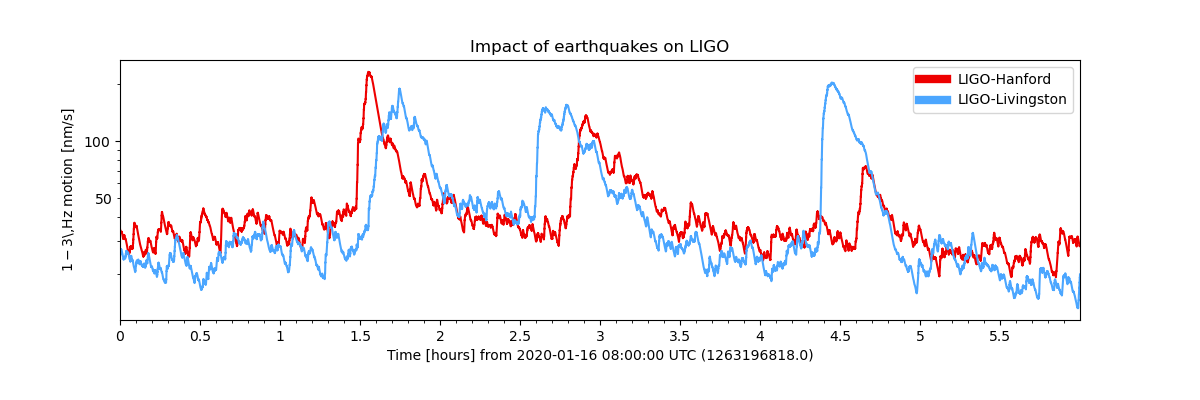
As we can see, the earthquake had a huge impact on the LIGO observatories, severly impairing operations for several hours.
Total running time of the script: (0 minutes 4.905 seconds)