Note
Go to the end to download the full example code.
Plotting an over-dense, short-duration Spectrogram
The normal spectrogram method uses non-overlapping intervals
to calculate discrete PSDs for each stride. This is fine for long-duration
data, but give poor resolution when studying short-duration phenomena.
The spectrogram2 method allows for highly-overlapping FFT
calculations to over-sample the frequency content of the input TimeSeries
to produce a much more feature-rich output.
To demonstrate this, we can download some data associated with the gravitational-wave event GW510914:
from gwpy.timeseries import TimeSeries
lho = TimeSeries.fetch_open_data("H1", 1126259458, 1126259467)
and can highpass() and whiten()
the remove low-frequency noise and try and enhance low-amplitude signals
across the middle of the frequency band:
hp = lho.highpass(20)
white = hp.whiten(4, 2).crop(1126259460, 1126259465)
Note
We chose to crop() out the leading and trailing 2
seconds of the the whitened data series here to remove any filtering
artefacts that may have been introduced.
Now we can call the spectrogram2 method of gwdata to
calculate our over-dense Spectrogram, using a
1/16-second FFT length and high overlap:
specgram = white.spectrogram2(fftlength=1/16., overlap=15/256.) ** (1/2.)
specgram = specgram.crop_frequencies(20)  # drop everything below highpass
Finally, we make a plot:
plot = specgram.plot(norm="log", cmap="viridis", yscale="log")
ax = plot.gca()
ax.set_title("LIGO-Hanford strain data around GW150914")
ax.set_xlim(1126259462, 1126259463)
ax.colorbar(label=r"Strain ASD [1/$\sqrt{\mathrm{Hz}}$]")
plot.show()
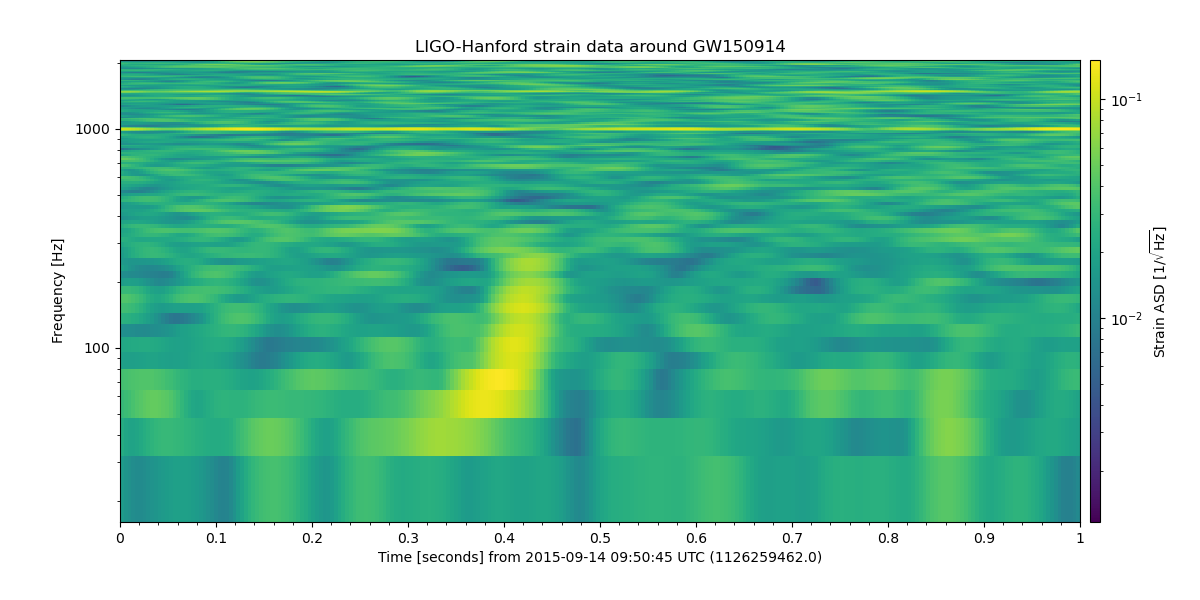
Here we can see the trace of a high-mass binary black hole system, referred to as GW150914. For more details on this signal, please see Abbott et al. (2016) (the joint LSC-Virgo publication announcing this detection).
Total running time of the script: (0 minutes 0.797 seconds)