4. Calculating (and plotting) rate versus time for an EventTable
I would like to study the rate at which event triggers are generated by the
ExcessPower gravitational-wave burst detection algorithm, over a small
stretch of data.
The data from which these events were generated contain a simulated gravitational-wave signal, or hardware injection, used to validate the performance of the LIGO detectors and downstream data analysis procedures.
First, we import the EventTable object and read in a set of events from
a LIGO_LW-format XML file containing a
sngl_burst table
from gwpy.table import EventTable
events = EventTable.read('H1-LDAS_STRAIN-968654552-10.xml.gz',
                         tablename='sngl_burst', columns=['peak', 'snr'])
Note
Here we manually specify the columns to read in order to optimise
the read() operation to parse only the data we actually need.
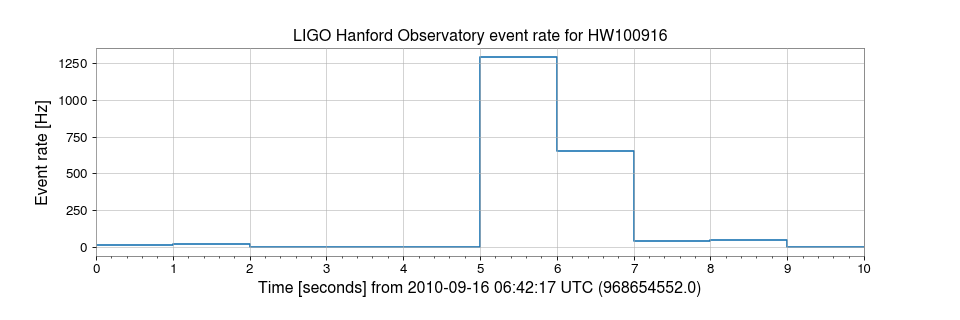
We can calculate the rate of events (in Hertz) using the
event_rate() method:
rate = events.event_rate(1, start=968654552, end=968654562)
The event_rate() method has returned a
TimeSeries, so we can display this using the
step() method of that object:
plot = rate.step()
ax = plot.gca()
ax.set_xlim(968654552, 968654562)
ax.set_ylabel('Event rate [Hz]')
ax.set_title('LIGO Hanford Observatory event rate for HW100916')
plot.show()
(png)
