Plotting in GWpy (gwpy.plot)
Basic plotting
The gwpy.plot module provides integrated extensions to the fantastic
data visualisation tools provided by matplotlib.
Basic plotting with pyplot
Each of the data representations provided by gwpy can be directly passed
to the standard methods available in pyplot:
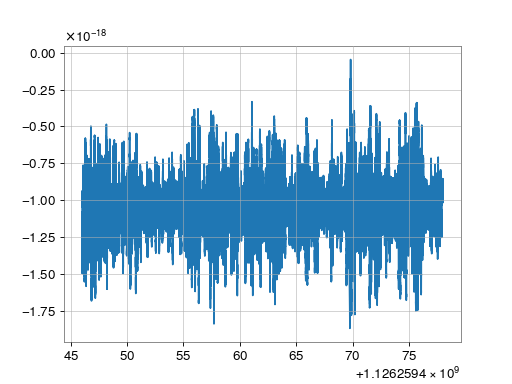
>>> from gwpy.timeseries import TimeSeries
>>> data = TimeSeries.fetch_open_data('L1', 1126259446, 1126259478)
>>> from matplotlib import pyplot as plt
>>> plt.plot(data)
>>> plt.show()
(png)
.plot() instance methods
Each of the data representations provided by gwpy also come with a
.plot() method that provides a figure with improved defaults tailored
to those data:
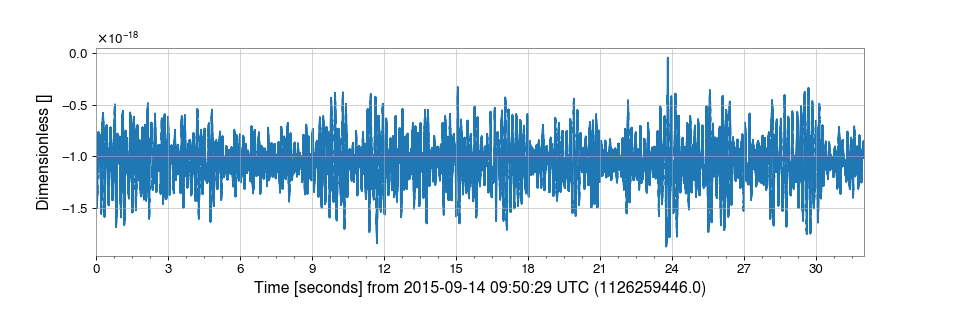
>>> from gwpy.timeseries import TimeSeries
>>> data = TimeSeries.fetch_open_data('L1', 1126259446, 1126259478)
>>> plot = data.plot()
>>> plot.show()
(png)
The .plot() methods accept any keywords that can be used to create the
Figure and the Axes,
and to draw the element itself, e.g:
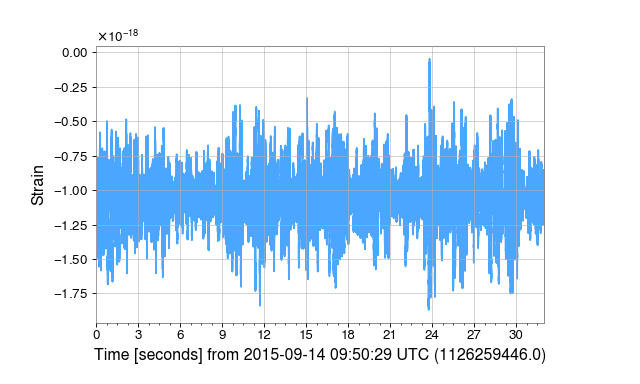
>>> from gwpy.timeseries import TimeSeries
>>> data = TimeSeries.fetch_open_data('L1', 1126259446, 1126259478)
>>> plot = data.plot(figsize=(8, 4.8), ylabel='Strain',
...                  color='gwpy:ligo-livingston')
>>> plot.show()
(png)
Multi-data plots
GWpy enables trivial generation of plots with multiple datasets.
The Plot constructor will accept an arbitrary
collection of data objects and will build a figure with the required geometry
automatically.
By default, a flat set of objects are shown on the same axes:
>>> from gwpy.timeseries import TimeSeries
>>> hdata = TimeSeries.fetch_open_data('H1', 1126259446, 1126259478)
>>> ldata = TimeSeries.fetch_open_data('L1', 1126259446, 1126259478)
>>> from gwpy.plot import Plot
>>> plot = Plot(hdata, ldata, figsize=(12, 4.8))
>>> plot.show()
(png)

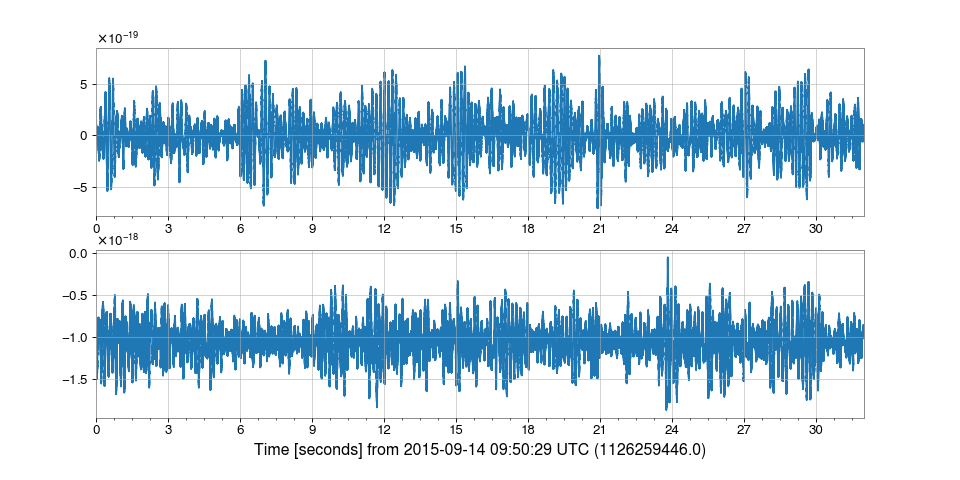
However, separate=True can be given to show each dataset on a separate
Axes:
>>> plot = Plot(hdata, ldata, figsize=(12, 6), separate=True, sharex=True)
>>> plot.show()
(png)
Warning
The Plot constructor can only handle one plotting method at any time
(e.g. ax.plot(), ax.imshow()), so you can’t create plots with
a line and an image using this call,
for example.