Custom legends in GWpy
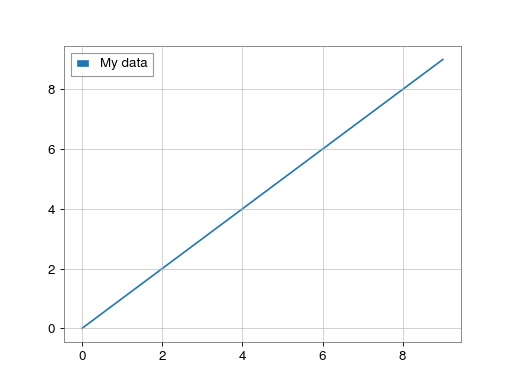
GWpy overrides the default Axes class with one that
uses a different default legend handler for line plots.
This means that, by default, lines in a legend will be thicker than on a
standard matplotlib figure:
>>> import gwpy  # <- import anything from gwpy
>>> from matplotlib import pyplot
>>> fig = pyplot.figure()
>>> ax = fig.gca()
>>> ax.plot(range(10), label='My data')
>>> ax.legend()
>>> fig.show()
(png)

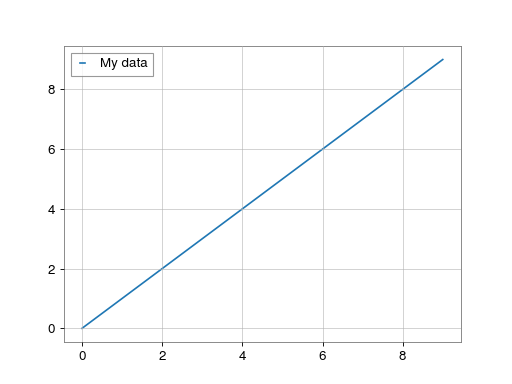
This can be disabled by passing an empty handler_map to the
legend() method:
>>> fig = pyplot.figure()
>>> ax = fig.gca()
>>> ax.plot(range(10), label='My data')
>>> ax.legend(handler_map=None)
>>> fig.show()
(png)
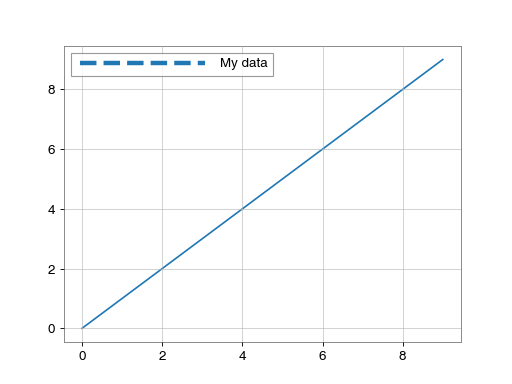
Similarly, you can implement your own custom legend handler and overwrite things yourself. Below is a simple example, but for more details see Legend guide.
>>> from matplotlib.legend_handler import HandlerLine2D
>>> from matplotlib.lines import Line2D
>>> class MyHandler(HandlerLine2D):
...     def create_artists(self, *args, **kwargs):
...         line, = super().create_artists(*args, **kwargs)
...         line.set_linewidth(4.)
...         line.set_linestyle('--')
...         return [line]
>>> fig = pyplot.figure()
>>> ax = fig.gca()
>>> ax.plot(range(10), label='My data')
>>> ax.legend(handler_map={Line2D: MyHandler()}, handlelength=10)
>>> fig.show()
(png)
