Note
Go to the end to download the full example code.
Plotting an EventTable in a scatter
We can use GWpy’s EventTable to download the catalogue of gravitational-wave
detections, and create a scatter plot to investigate the mass distribution
of events.
First, we can download the 'GWTC-1-confident' catalogue using
EventTable.fetch_open_data():
from gwpy.table import EventTable
events = EventTable.fetch_open_data(
    "GWTC",
    columns=(
        "mass_1_source",
        "mass_2_source",
        "luminosity_distance",
        "network_matched_filter_snr",
    ),
)
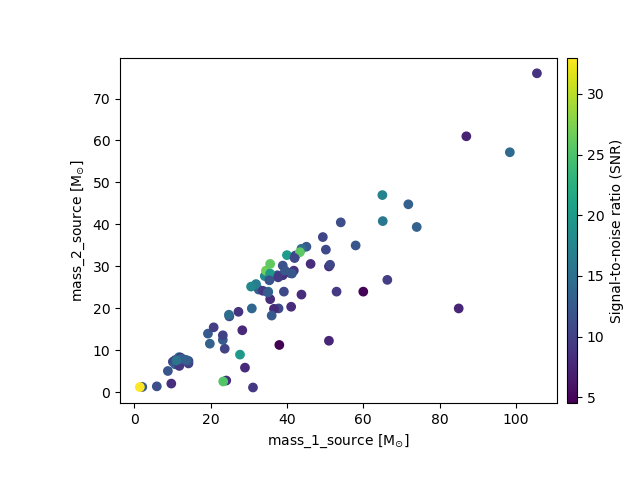
We can now make a scatter plot by specifying the x- and y-axis columns, and (optionally) the colour:
plot = events.scatter(
    "mass_1_source", "mass_2_source",
    color="network_matched_filter_snr",
)
plot.colorbar(label="Signal-to-noise ratio (SNR)")
plot.show()
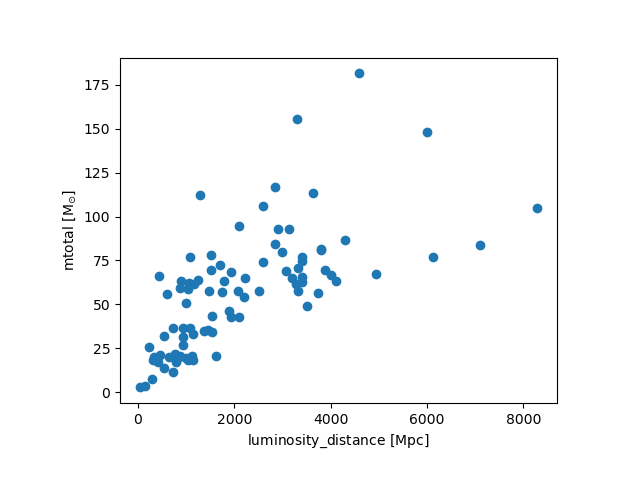
We can similarly plot how the total event mass is distributed with
distance. First we have to build the total mass ('mtotal') column
from the component masses:
events.add_column(
    events["mass_1_source"] + events["mass_2_source"],
    name="mtotal"
)
and now can make a new scatter plot:
plot = events.scatter("luminosity_distance", "mtotal")
plot.show()
Total running time of the script: (0 minutes 0.195 seconds)