Note
Go to the end to download the full example code.
Transfer function
In this example we demonstrate how to calculate the transfer function
between two TimeSeries signals.
All ground-based gravitational wave observatories would be unable to operate if they did not employ sophisticated ground-motion suppression technology to prevent vibrations from the local (or remote) environment from transferring through to optical components.
The impact of the seismic isolation system can be seen by calculating the transfer function between the ground motion at the laboratory and that of the optical suspension points.
from gwpy.time import tconvert
from gwpy.timeseries import TimeSeriesDict
from gwpy.plot import BodePlot
For this example we will use data from the Auxiliary Channel Three Hour Release:
start = tconvert("August 14 2017 10:25")
end = start + 1800
gndchannel = "L1:ISI-GND_STS_ITMY_Y_DQ"
suschannel = "L1:ISI-ITMY_SUSPOINT_ITMY_EUL_L_DQ"
We can call the get() method of the TimeSeriesDict
to retrieve all data in a single operation:
data = TimeSeriesDict.get(
    [gndchannel, suschannel],
    start,
    end,
    host="nds.gwosc.org",
)
gnd = data[gndchannel]
sus = data[suschannel]
The transfer function between time series is easily computed with the
transfer_function() method:
tf = gnd.transfer_function(sus, fftlength=128, overlap=64)
The BodePlot knows how to separate a complex-valued
FrequencySeries into magnitude and phase:
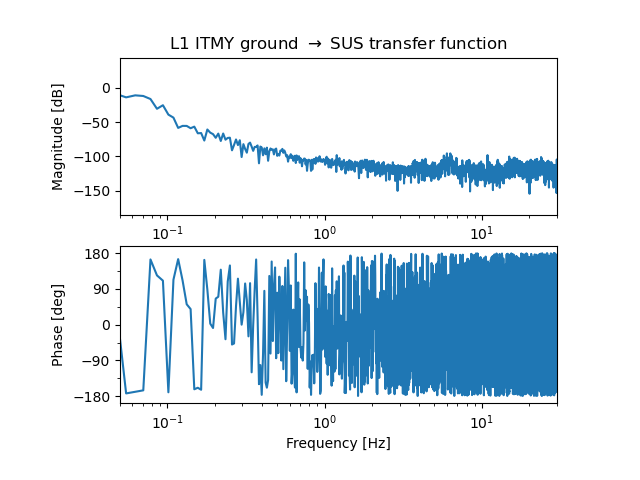
plot = BodePlot(tf)
plot.maxes.set_title(
    r"L1 ITMY ground $\rightarrow$ SUS transfer function",
)
plot.maxes.set_xlim(5e-2, 30)
plot.show()

# This example demonstrates the impressive noise suppression of the LIGO
# seismic isolation system. For more details, please see
# https://www.ligo.caltech.edu/page/vibration-isolation.
Total running time of the script: (0 minutes 2.526 seconds)