Note
Go to the end to download the full example code.
Estimating the spectral contribution to inspiral range
Generating an inspiral range timeseries shows how the binary neutron star (BNS) inspiral range of a gravitational-wave detector can be measured directly from the strain readout.
In this example, we estimate the average spectral
contribution to BNS range from the strain record surrounding GW170817
using gwpy.astro.range_spectrogram().
Data access
First, we need to load some data.
For this we can fetch the public data
around the GW170817 BNS merger:
from gwpy.timeseries import TimeSeries
l1 = TimeSeries.fetch_open_data("L1", 1187006834, 1187010930)
Generate a range Spectrogram
Then, we can calculate a Spectrogram of the inspiral range
amplitude spectrum:
from gwpy.astro import range_spectrogram
l1spec = range_spectrogram(l1, 30, fftlength=4, fmin=15, fmax=500) ** (1./2)
/home/duncan.macleod/gwpy-nightly-build/conda/envs/gwpy-nightly-3.11/lib/python3.11/site-packages/inspiral_range/waveform.py:369: DeprecationWarning: `trapz` is deprecated. Use `trapezoid` instead, or one of the numerical integration functions in `scipy.integrate`.
  return np.sqrt(4*np.trapz((h**2)/psd, self.freq))
Visualisation
We can plot this Spectrogram to visualise spectral variation in
LIGO-Livingston’s sensitivity in the hour or so surrounding GW170817:
plot = l1spec.plot(figsize=(12, 5))
ax = plot.gca()
ax.set_yscale("log")
ax.set_ylim(15, 500)
ax.set_title("LIGO-Livingston sensitivity to BNS around GW170817")
ax.set_epoch(1187008882)  # <- set 0 on plot to GW170817
ax.colorbar(
    cmap="cividis",
    clim=(0, 16),
    label=r"BNS range amplitude spectral density [Mpc/$\sqrt{\mathrm{Hz}}$]",
)
plot.show()
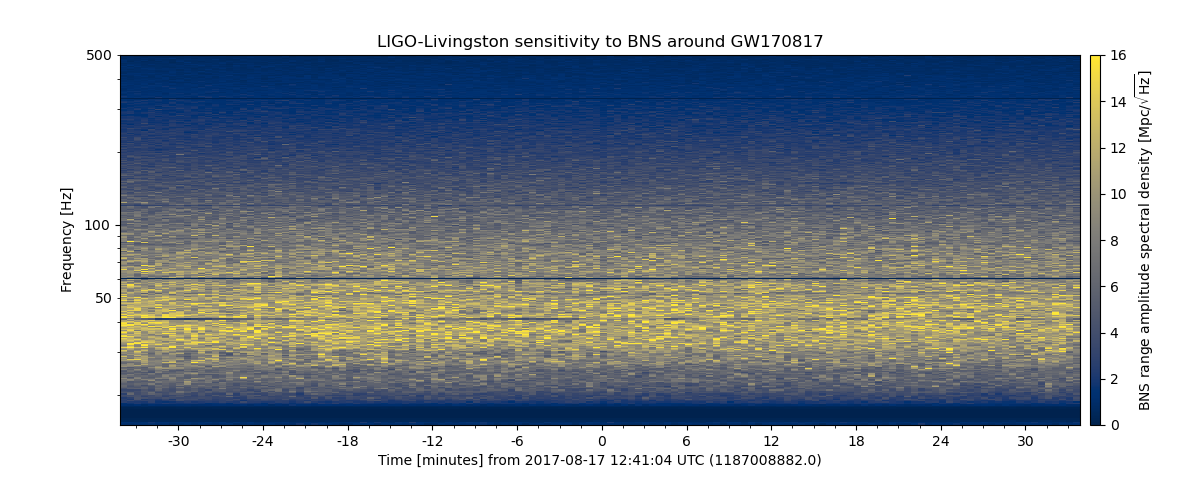
Note, the extreme dip in sensitivity near GW170817 is caused by a loud, transient noise event, see Phys. Rev. Lett. vol. 119, p. 161101 for more information.
Total running time of the script: (0 minutes 2.499 seconds)