Note
Go to the end to download the full example code.
Generating an inspiral range timeseries
One standard figure-of-merit for the sensitivity of a gravitational-wave
detector is the distance to which a binary neutron star (BNS) inspiral
with two 1.4 solar mass components would be detected with a signal-to-noise
ratio (SNR) of 8. We can estimate this using
gwpy.astro.range_timeseries() directly from the strain readout for
a detector.
Data access
First, we need to load some data. We can fetch the
public data
around the GW170817 BNS merger:
from gwpy.timeseries import TimeSeries
h1 = TimeSeries.fetch_open_data("H1", 1187006834, 1187010930)
l1 = TimeSeries.fetch_open_data("L1", 1187006834, 1187010930)
Range estimation
Then, we can measure the inspiral range directly, at 30 second granularity with a 4-second FFT length starting at 10 Hz:
from gwpy.astro import range_timeseries
h1range = range_timeseries(h1, 30, fftlength=4, fmin=10)
l1range = range_timeseries(l1, 30, fftlength=4, fmin=10)
/home/duncan.macleod/gwpy-nightly-build/conda/envs/gwpy-nightly-3.11/lib/python3.11/site-packages/inspiral_range/waveform.py:369: DeprecationWarning: `trapz` is deprecated. Use `trapezoid` instead, or one of the numerical integration functions in `scipy.integrate`.
  return np.sqrt(4*np.trapz((h**2)/psd, self.freq))
Visualisation
We can now plot these trends to see the variation in LIGO sensitivity over an hour or so surrounding GW170817:
plot = h1range.plot(
    label="LIGO-Hanford",
    color="gwpy:ligo-hanford",
    figsize=(12, 5),
)
ax = plot.gca()
ax.plot(l1range, label="LIGO-Livingston", color="gwpy:ligo-livingston")
ax.set_ylabel("Angle-averaged sensitive distance [Mpc]")
ax.set_title("LIGO sensitivity to BNS around GW170817")
ax.set_epoch(1187008882)  # <- set 0 on plot to GW170817
ax.legend()
plot.show()
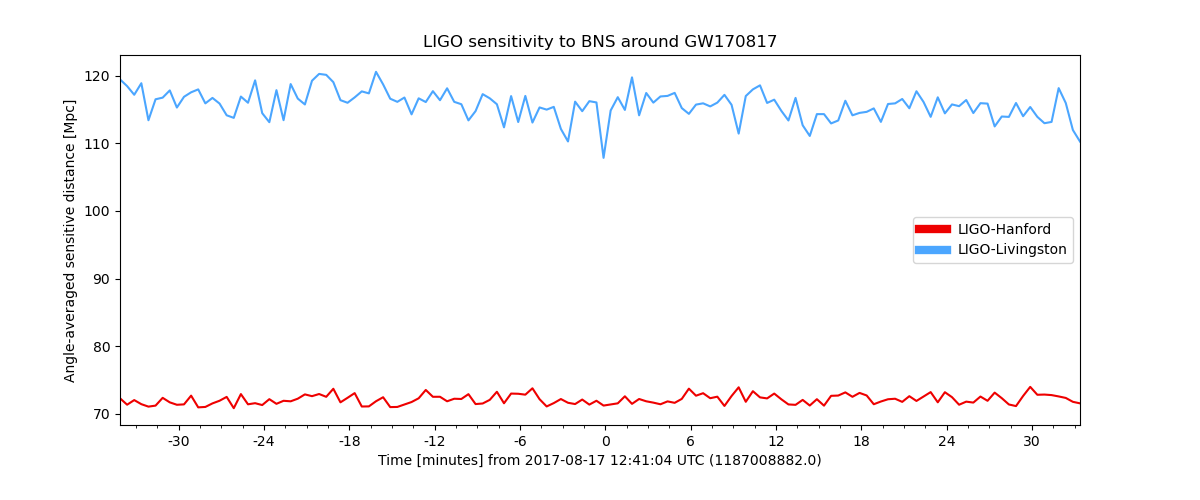
Note, the extreme dip in LIGO-Livingston’s sensitivity near GW170817 is caused by a loud, transient noise event, see Phys. Rev. Lett. vol. 119, p. 161101 for more information.
Total running time of the script: (0 minutes 6.082 seconds)