4. Calculating the time-dependent coherence between two channels
The standard coherence calculation outputs a frequency series
(FrequencySeries) giving a time-averaged measure
of coherence. See Calculating the coherence between two channels for an
example.
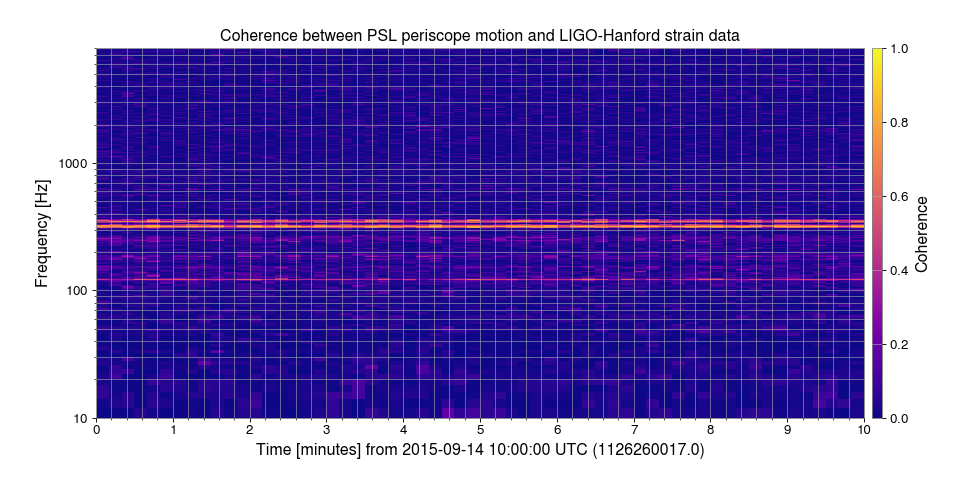
The TimeSeries method coherence_spectrogram() performs the
same coherence calculation every stride, giving a time-varying coherence
measure.
First, we import the TimeSeriesDict
from gwpy.timeseries import TimeSeriesDict
and then get() the data for the strain output
(H1:GDS-CALIB_STRAIN) and the PSL periscope accelerometer
(H1:PEM-CS_ACC_PSL_PERISCOPE_X_DQ):
data = TimeSeriesDict.get(
    ['H1:GDS-CALIB_STRAIN', 'H1:PEM-CS_ACC_PSL_PERISCOPE_X_DQ'],
    1126260017,
    1126260617,
)
hoft = data['H1:GDS-CALIB_STRAIN']
acc = data['H1:PEM-CS_ACC_PSL_PERISCOPE_X_DQ']
We can then calculate the coherence() of one
TimeSeries with respect to the other, using an 2-second Fourier
transform length, with a 1-second (50%) overlap:
coh = hoft.coherence_spectrogram(acc, 10, fftlength=.5, overlap=.25)
Finally, we can plot() the
resulting data
plot = coh.plot()
ax = plot.gca()
ax.set_ylabel('Frequency [Hz]')
ax.set_yscale('log')
ax.set_ylim(10, 8000)
ax.set_title(
    'Coherence between PSL periscope motion and LIGO-Hanford strain data',
)
ax.grid(True, 'both', 'both')
ax.colorbar(label='Coherence', clim=[0, 1], cmap='plasma')
plot.show()
(png)
