The Spectrogram
While the TimeSeries allows us to study how the amplitude of a signal changes over time, and the FrequencySeries allows us to study how that amplitude changes over frequency, the time-frequency Spectrogram allows us to track the evolution of the FrequencySeries over time.
This object is a 2-dimensional array, essentially a stacked set of spectra, one per unit time.
As always, a Spectrogram can be generated from any arbitrary data sequence, but here the required metadata are a combination of those required for the TimeSeries and FrequencySeries:
>>> import numpy
>>> specgram = Spectrogram(numpy.random.random((100, 1000)), epoch=1000000000, sample_rate=1, f0=0, df=1)
>>> print(specgram)
Spectrogram([[ 0.58030742  0.94586261  0.79559404 ...,  0.25253688  0.61626489
               0.22785403]
             [ 0.95930736  0.93154594  0.13234058 ...,  0.13920997  0.94432426
               0.29442085]
             [ 0.66572174  0.77702177  0.8900096  ...,  0.18828231  0.81440898
               0.97455031]
             ...,
             [ 0.46696636  0.72475187  0.17941277 ...,  0.19095158  0.83843501
               0.92154324]
             [ 0.81492468  0.01945053  0.77665596 ...,  0.73642962  0.78723728
               0.20995951]
             [ 0.35161785  0.79137264  0.50710421 ...,  0.39068193  0.61551753
               0.74846848]],
            name: None,
            unit: None,
            epoch: 2011-09-14 01:46:59.000,
            dt: 1 s,
            f0: 0 Hz,
            df: 1 Hz,
            logf: False)
The full set of metadata that can be provided is as follows:
Name for this data set |
|
The physical unit of these data |
|
Starting GPS epoch for this |
|
Time-spacing for this |
|
Starting frequency for this |
|
Frequency spacing of this |
Calculating a Spectrogram from a TimeSeries
The time-frequency Spectrogram of a TimeSeries can be calculated using the spectrogram() method.
We can extend previous examples of plotting a TimeSeries with calculation of a Spectrogram with a 20-second stride:
>>> from gwpy.timeseries import TimeSeries
>>> gwdata = TimeSeries.fetch_open_data(
...     "H1",
...     "Sep 14 2015 09:45",
...     "Sep 14 2015 09:55",
... )
>>> specgram = gwdata.spectrogram(20, fftlength=8, overlap=4) ** (1/2.)
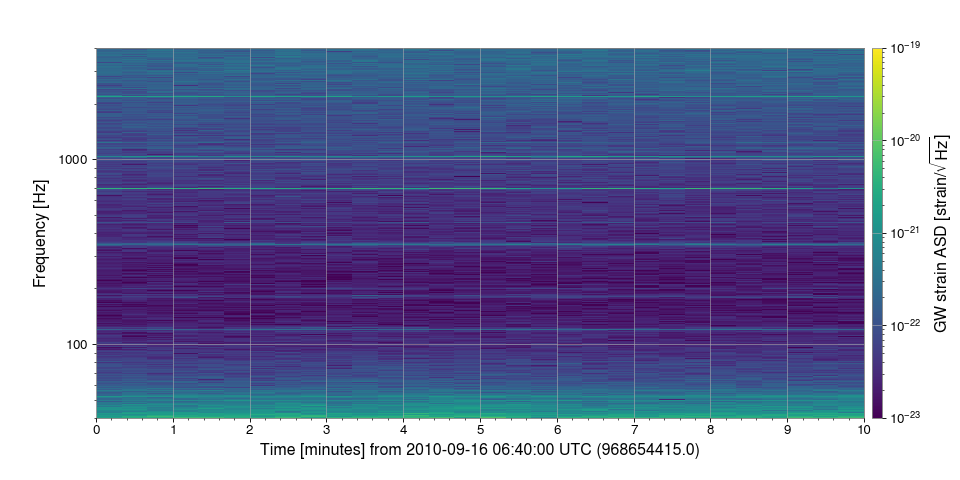
Plotting a Spectrogram
Like the TimeSeries and FrequencySeries, the Spectrogram has a convenient plot() method, allowing us to view the data.
We can extend the previous time-series example to include a plot:
>>> plot = specgram.plot(norm='log', vmin=5e-24, vmax=1e-20)
>>> ax = plot.gca()
>>> ax.set_ylim(10, 2000)
>>> ax.set_yscale('log')
>>> ax.colorbar(label='GW strain ASD [strain/$\sqrt{\mathrm{Hz}}$]')
>>> plot.show()
(png)

Spectrogram applications
Reference/API
A 2D array holding a spectrogram of time-frequency data |