State vectors
>>> from gwpy.timeseries import (StateTimeSeries, StateVector)
A large quantity of important data from gravitational-wave detectors
can be distilled into simple boolean (True or False) statements
informing something about the state of the instrument at a given time.
These statements can be used to identify times during which a particular
control system was active, or when the signal in a seismometer was above
an alarming threshold, for example.
In GWpy, these data are represented by special cases (sub-classes) of
the TimeSeries object:
Boolean array representing a good/bad state determination |
|
Binary array representing good/bad state determinations of some data. |
The StateTimeSeries
The example of a threshold on signal time-series is the core of a large
amount of low-level data quality information, used in searches for
gravitational waves, and detector characterisation, and is described by the
StateTimeSeries object, a specific type of TimeSeries
containing only boolean values.
These arrays can be generated from simple arrays of booleans, as follows:
>>> from gwpy.timeseries import StateTimeSeries
>>> state = StateTimeSeries(
...     [True, True, False, False, False, True, False],
...     sample_rate=1,
...     epoch=1064534416,
... )
>>> print(state)
StateTimeSeries([ True,  True, False, False, False,  True, False]
                unit: dimensionless,
                t0: 1064534416.0 s,
                dt: 1.0 s,
                name: None,
                channel: None)
Alternatively, applying a standard mathematical comparison to a regular
TimeSeries will return a StateTimeSeries:
>>> from gwpy.timeseries import TimeSeries
>>> laserpower = TimeSeries.get(
...     "H1:IMC-PWR_IN_OUT_DQ",
...     1186741850,
...     1186741870,
...     host="losc-nds.ligo.org",
... )
>>> threshold = 29.2 > laserpower.unit
>>> above_29_2 = laserpower > threshold
>>> print(above_2915)
StateTimeSeries([False, False, False, ..., False, False, False]
                unit: dimensionless,
                t0: 1186741850.0 s,
                dt: 0.00048828125 s,
                name: H1:IMC-PWR_IN_OUT_DQ > 29.2 NONE,
                channel: H1:IMC-PWR_IN_OUT_DQ)
The StateTimeSeries includes a handy
StateTimeSeries.to_dqflag() method to convert the boolean array
into a DataQualityFlag, where the active
segments represent times of True values:
>>> segments = above_29_2.to_dqflag(round=True)
>>> print(segments)
<DataQualityFlag('H1:IMC-PWR_IN_OUT_DQ > 29.2 NONE',
                 known=[[1186741850.0 ... 1186741870.0)]
                 active=[[1186741854.0 ... 1186741856.0)
                         [1186741859.0 ... 1186741861.0)
                         [1186741865.0 ... 1186741867.0)]
                 description=None)>
round=True
Here we included the keyword round=True to pad out active
segments to be at least one second long.
The usage in this example is purely demonstrative, but is used regularly
when constructing data quality flags for excising bad data from
analyses, mainly because integer segments are easier to deal with.
Multi-bit state-vectors
While the StateTimeSeries represents a single True/False
statement about the state of a system, the StateVector gives a
grouping of these, representing a
bit array where each bit
represents a single True/False (on/off) binary state in a system.
This provides a compact representation of a complex system, with utility
methods to transform and visualise the myriad states.
Each GWOSC data release includes a bit vector that describes the data-quality states of the detector.
GWOSC data usage notes
Refer to the GWOSC data usage notes page for details of the various bits (states) in the state vectors.
To demonstate, we can download the StateVector associated with
GW200105, the first detection of a mixed black hole/neutron star
binary system:
>>> from gwosc.datasets import event_gps
>>> from gwpy.timeseries import StateVector
>>> gps = event_gps("GW200105_162426")
>>> start = int(gps) - 1000
>>> end = int(gps) + 1000
>>> gw200105_state = StateVector.fetch_open_data("L1", start, end)
>>> print(gw200105_state)
StateVector([127, 127, 127, ..., 127, 127, 127]
            unit: dimensionless,
            t0: 1262275684.0 s,
            dt: 1.0 s,
            name: Data quality,
            channel: None,
            bits: Bits(0: Passes DATA test
                        1: Passes CBC_CAT1 test
                        2: Passes CBC_CAT2 test
                        3: Passes CBC_CAT3 test
                        4: Passes BURST_CAT1 test
                        5: Passes BURST_CAT2 test
                        6: Passes BURST_CAT3 test,
                        channel=None,
                        epoch=1262274636.0))
As can be seen, the list of bits is represented
through the BitMask class, recording the bits as a list with
some metdata about their purpose.
The StateVector fetched in the above example can then be parsed into a
series of DataQualityFlag objects, recording the
active segments for that bit in the vector:
>>> flags = gw200105_state.to_dqflags()
>>> print(flags["Passes BURST_CAT3 test"])
<DataQualityFlag('Passes BURST_CAT3 test',
                 known=[[1262275684.0 ... 1262277684.0)]
                 active=[[1262275684.0 ... 1262276525.0)
                         [1262276527.0 ... 1262277684.0)]
                 description=None)>
Here we can see that there are two active segments for the
Passes BURST_CAT3 test bit, indicating that there is a short interval
(2 seconds in this case) where the BURST_CAT3 data quality check failed.
Plotting a StateVector
A StateVector can be trivially plotted in two ways,
specified by the format keyword argument of the plot()
method:
Format |
Description |
|---|---|
|
A bit-wise representation of each bit in the vector (default) |
|
A standard time-series representation |
For example,
>>> plot = gw200105_state.plot(insetlabels=True)
>>> plot.show()
(png)
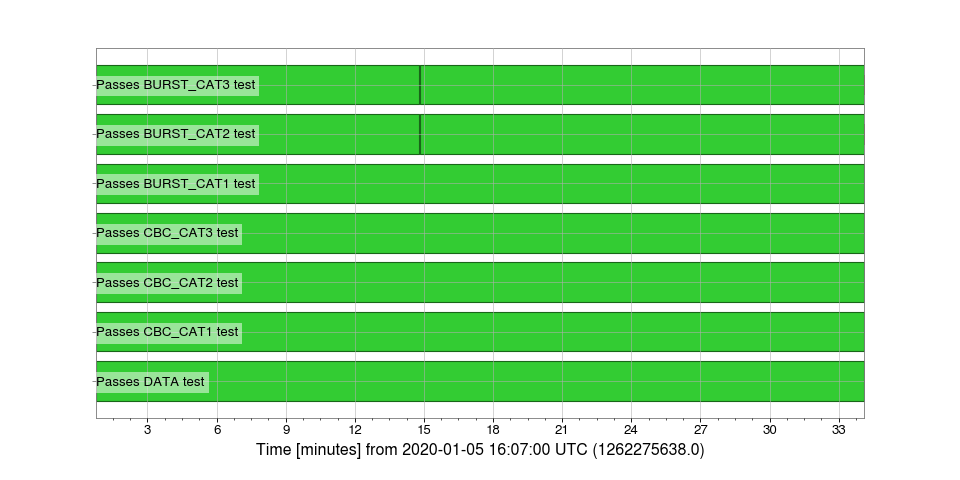
In this figure the black vertical lines (actually very dark green) show
visually the short interval where both the BURST_CAT2 and
BURST_CAT3 data-quality checks failed, just over 2 minutes prior to
the GW200102 event detection.
Bit labelling
For a format='segments' display, the bits
attribute of the StateVector is used to identify and label each
of the binary bits in the vector.
insetlabels
The insetlabels=True keyword was given to display the bit labels
inside the axes (otherwise they would be cut off the side of the figure).
Associated classes
Alongside the StateVector class, gwpy.timeseries provides a
StateVectorDict for handling collections of bit-vector data
(mainly to enable reading and writing multiple StateVector in one operation).
Reference/API
The above documentation references the following objects:
Binary array representing good/bad state determinations of some data. |
|
Boolean array representing a good/bad state determination |
|
Ordered key-value mapping of named |