Plotting segments for a StateVector
I would like to examine the state of the internal seismic isolation system supporting the Fabry-Perot mirror at the end of the Y-arm at LHO, in order to investigate a noise source.
These data are private to the LIGO Scientific Collaboration and the Virgo Collaboration, but collaboration members can use the NDS2 service to download data.
First, we can import the StateVector class:
from gwpy.timeseries import StateVector
Next, we define which bits we want to use, and can then
get() the data:
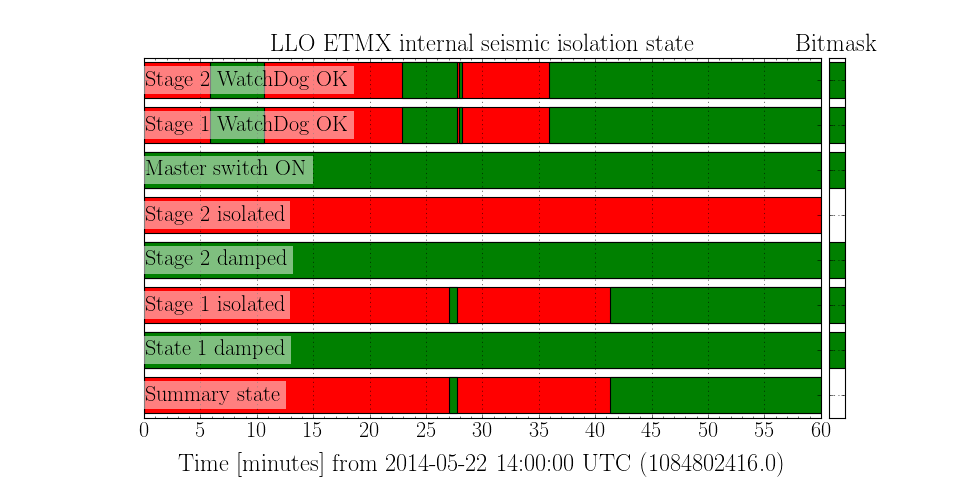
bits = [
    'Summary state',
    'State 1 damped',
    'Stage 1 isolated',
    'Stage 2 damped',
    'Stage 2 isolated',
    'Master switch ON',
    'Stage 1 WatchDog OK',
    'Stage 2 WatchDog OK',
]

data = StateVector.get('L1:ISI-ETMX_ODC_CHANNEL_OUT_DQ', 'May 22 2014 14:00', 'May 22 2014 15:00', bits=bits)
For this example, we wish to resample() the data to a
much lower rate, to make visualising the state much easier:
data = data.resample(16)
Finally, we make a plot(), passing insetlabels=True to
display the bit names inside the axes:
plot = data.plot(insetlabels=True)
plot.set_title('LLO ETMX internal seismic isolation state')
plot.add_bitmask('0b11101110')
plot.show()
(Source code, png)