Generate the Q-transform of a TimeSeries
First, we identify the GPS time of interest:
gps = 968654558
and use that to define the start and end times of our required data
duration = 32
start = int(round(gps - duration/2.))
end = start + duration
next, we import the TimeSeries and fetch some open data from
LOSC:
from gwpy.timeseries import TimeSeries
data = TimeSeries.fetch_open_data('H1', start, end)
and next we generate the q_transform of these data:
qspecgram = data.q_transform()
Now, we can plot the resulting Spectrogram, focusing on a
specific window around the interesting time
Note
Using crop is highly recommended at
this stage because rendering the high-resolution spectrogram as it is
done here is very slow (for experts this is because we’re using
pcolormesh and not any sort of image
interpolation, mainly to support both linear and log scaling nicely)
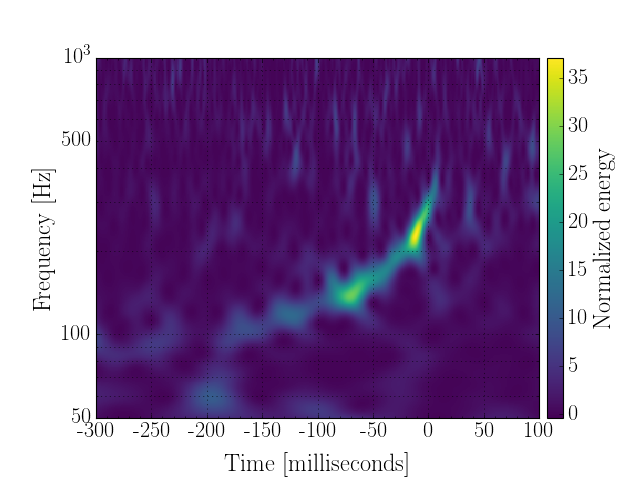
plot = qspecgram.crop(gps-.3, gps+.1).plot(figsize=[8, 6])
ax = plot.gca()
ax.set_epoch(gps)
ax.set_yscale('log')
ax.set_xlabel('Time [milliseconds]')
ax.set_ylim(50, 1000)
ax.grid(True, axis='y', which='both')
plot.add_colorbar(cmap='viridis', label='Normalized energy')
plot.show()
I think we just detected a gravitational wave signal! But, before you get too exited, this is an example of a ‘blind injection’, a simulated signal introduced into the interferometer(s) in order to test the detection process end-to-end. For more details, see here.
(Source code, png)