Signal processing
Oftentimes a TimeSeries is not the most informative way to look at data from a gravitational-wave interferometer.
GWpy provides convenient wrappers around some of the most common signal-processing methods.
Time-domain filtering:
highpass(frequency[, gpass, gstop, stop]) |
Filter this TimeSeries with a Butterworth high-pass filter. |
lowpass(frequency[, gpass, gstop, stop]) |
Filter this TimeSeries with a Butterworth low-pass filter. |
bandpass(flow, fhigh[, gpass, gstop, stops]) |
Filter this TimeSeries by applying low- and high-pass filters. |
zpk(zeros, poles, gain[, digital, unit]) |
Filter this TimeSeries by applying a zero-pole-gain filter |
Frequency-domain transforms:
psd([fftlength, overlap, method]) |
Calculate the PSD FrequencySeries for this TimeSeries. |
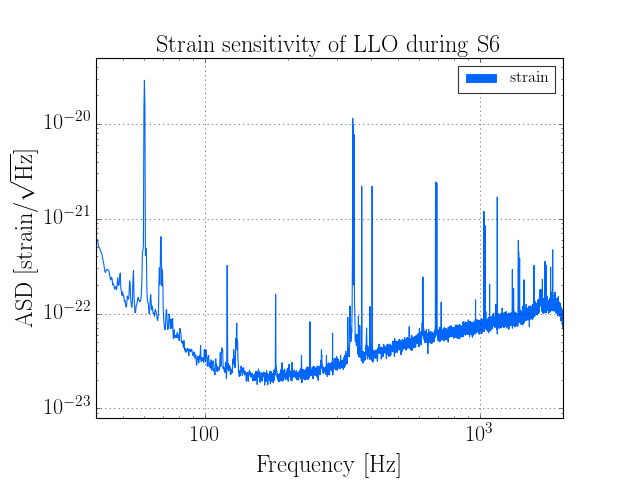
asd([fftlength, overlap, method]) |
Calculate the ASD FrequencySeries of this TimeSeries. |
spectrogram(stride[, fftlength, overlap, ...]) |
Calculate the average power spectrogram of this TimeSeries using the specified average spectrum method. |
q_transform([qrange, frange, gps, search, ...]) |
Scan a TimeSeries using a multi-Q transform |
rayleigh_spectrum([fftlength, overlap]) |
Calculate the Rayleigh FrequencySeries for this TimeSeries. |
rayleigh_spectrogram(stride[, fftlength, ...]) |
Calculate the Rayleigh statistic spectrogram of this TimeSeries |
Cross-channel correlations:
coherence(other[, fftlength, overlap, window]) |
Calculate the frequency-coherence between this TimeSeries and another. |
coherence_spectrogram(other, stride[, ...]) |
Calculate the coherence spectrogram between this TimeSeries and other. |
For example:
(Source code, png)
For more examples like this, see Examples.