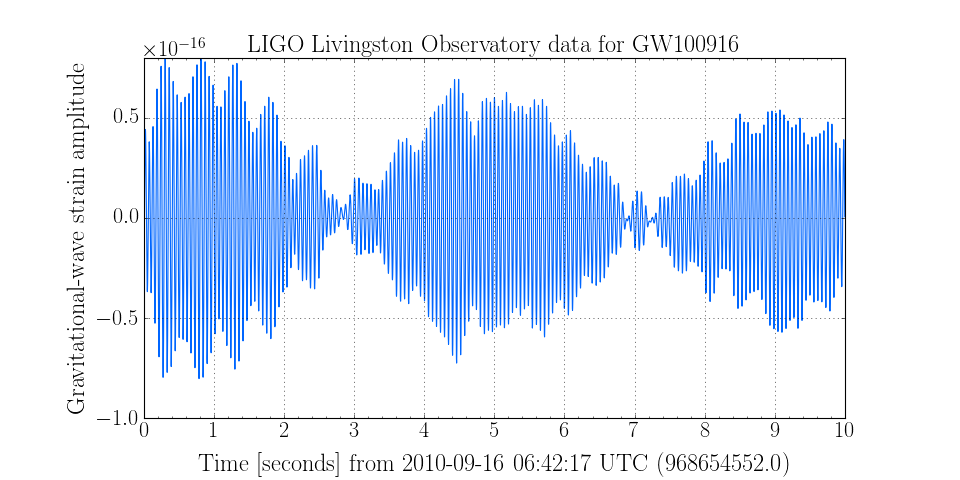
Plotting public LIGO data
I would like to study the gravitational wave strain time-series around the time of an interesting simulated signal during the last science run (S6).
These data are public, so we can load them directly from the web.
The TimeSeries object has a classmethod dedicated to fetching open-access
data hosted by the LIGO Open Science Center, so we can just import that
object
from gwpy.timeseries import TimeSeries
then call the fetch_open_data method, passing it the prefix
for the interferometer we want (‘L1’), and the GPS start and stop times of
our query:
data = TimeSeries.fetch_open_data('L1', 968654552, 968654562)
and then we can make a plot:
plot = data.plot()
plot.set_title('LIGO Livingston Observatory data for GW100916')
plot.set_ylabel('Gravitational-wave strain amplitude')
plot.show()
(Source code, png)