Whitening a TimeSeries
Most data recorded from a gravitational-wave interferometer carry information across a wide band of frequencies, typically up to a few kiloHertz, but often it is the case that the low-frequency amplitude dwarfs that of the high-frequency content, making discerning high-frequency features difficult.
We employ a technique called ‘whitening’ to normalize the power at all frequencies so that excess power at any frequency is more obvious.
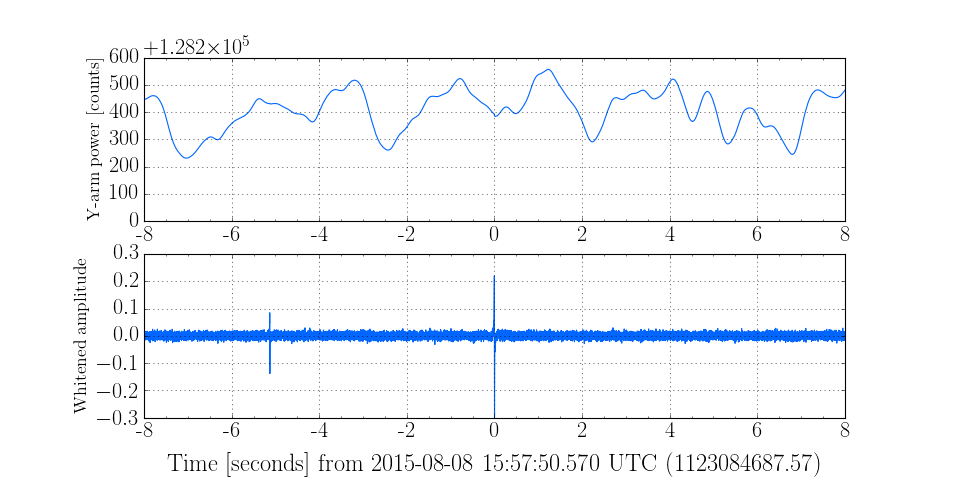
We demonstrate below with an auxiliary signal recording transmitted power in one of the interferometer arms, which recorded two large glitches with a frequency of around 5-50Hz.
First, we import the TimeSeries and get() the data:
from gwpy.timeseries import TimeSeries
data = TimeSeries.get('H1:ASC-Y_TR_A_NSUM_OUT_DQ', 1123084670, 1123084800)
Now, we can whiten the data to enhance the higher-frequency
content
white = data.whiten(4, 2)
and can plot both the original and whitened data
epoch = 1123084687.570
plot = data.plot()
plot.axes[0].set_ylabel('Y-arm power [counts]', fontsize=16)
plot.add_timeseries(white, newax=True, sharex=plot.axes[0])
plot.axes[1].set_ylabel('Whitened amplitude', fontsize=16)
plot.axes[0].set_epoch(epoch)
plot.axes[1].set_epoch(epoch)
plot.axes[0].set_xlim(epoch-8, epoch+8)
plot.axes[1].set_xlim(epoch-8, epoch+8)
plot.show()
Here we see two large spikes that are completely undetected in the raw
TimeSeries, but are very obvious in the whitened data.
(Source code, png)