Plotting an event histogram
I would like to study the snr distribution of event triggers generated by the ExcessPower gravitational-wave burst detection algorithm, over a small stretch of data.
The data from which these events were generated are a simulation of Gaussian noise with the Advanced LIGO design spectrum, and so don’t actually contain any real gravitational waves, but will help tune the algorithm to improve detection of future, real signals.
First, we import the SnglBurstTable, an XML-based data holder for single-detector (‘Sngl’) gravitational-wave burst-like events:
from gwpy.table.lsctables import SnglBurstTable
We can read a set of events using the read() method:
events = SnglBurstTable.read('../../gwpy/tests/data/H1-LDAS_STRAIN-968654552-10.xml.gz')
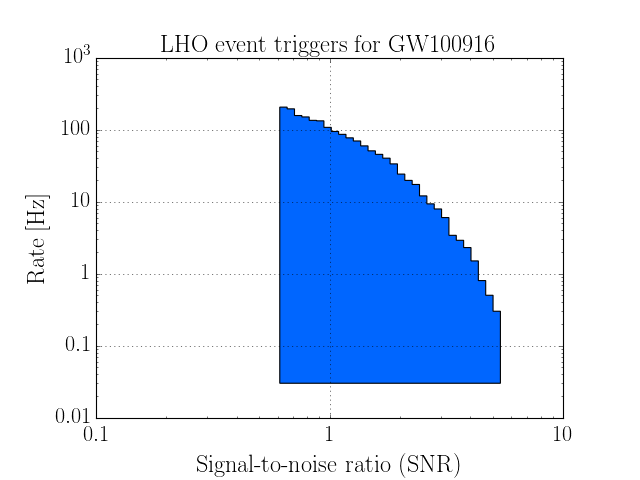
and can generate a new HistogramPlot using the hist() instance method
plot = events.hist('snr', weights=1/10., log=True, logbins=True, histtype='stepfilled', cumulative=-1)
plot.set_xlabel('Signal-to-noise ratio (SNR)')
plot.set_ylabel('Rate [Hz]')
plot.set_title('LHO event triggers for GW100916')
plot.show()
(Source code, png)