Spectrum plots
Spectrum plots label their axes as F and Y. It defaults to a log-log plot the most common if not
standard presentation in LIGO. To manually set the limits of the plot use --fmin and --fmax
for the frequency axis and --ymin and --ymax for the Amplitude axis. If any are left blank
they are set to the min or max of the data.
If you prefer linear axes use the --nologf and --nology parameters. This can be useful
to zoom in on peaks and lines in the spectrum.
The spectrum presented is an average of multiple FFTs controled by --secpfft and --overlap.
--secpfft specifies the length of the FFT in seconds (not limited to powers of 2 or integers)
and --overlap specifies a fractional overlap for the next FFT. For example a 1 second FFT of a
100 Hz channel with an overlap of 0.1 would generate the first FFT with samples 0-99 and the second
FFT with samples 10-109. More overlap results in more averaging and a higher SNR. Longer FFTs
result in better frequency resolution and less “frequency bleed”.
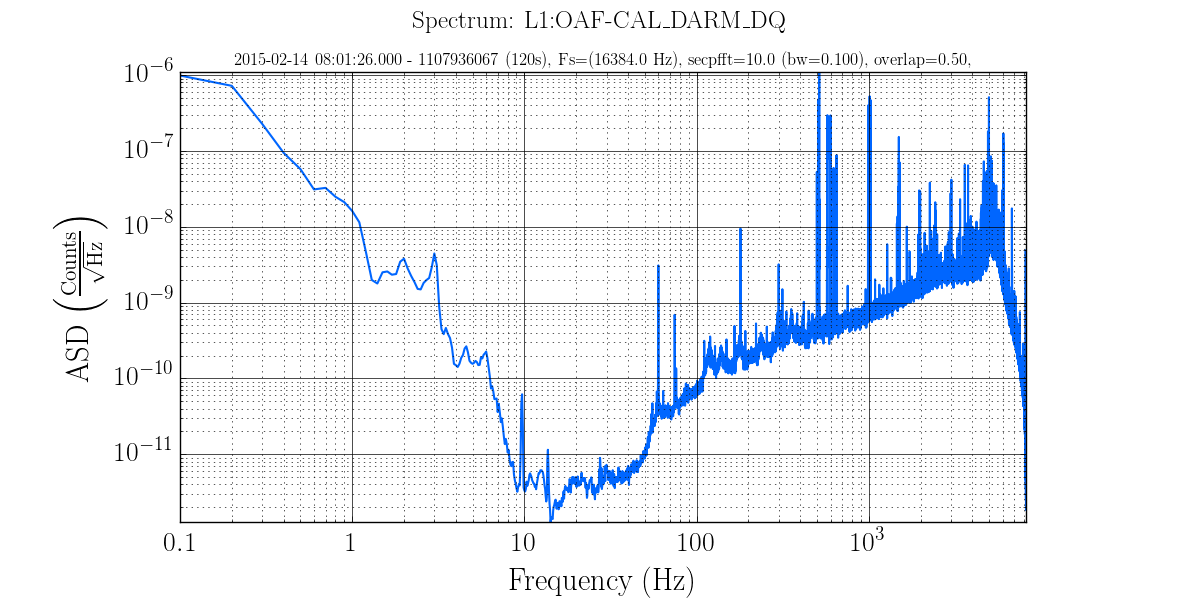
For example the following command line produces a fairly high frequency resolution plot of OAF-CAL_DARM from the 2014-02-14 lock at LLO:
gwpy-plot spectrum --chan L1:OAF-CAL_DARM_DQ --start 1107936067 --duration 120 --secpfft 10
To zoom in on the lines between 500 and 700 Hz we could use the following:
gwpy-plot spectrum --chan L1:OAF-CAL_DARM_DQ --start 1107936067 --duration 120 \
 --secpfft 10.000 --overlap 0.90 --nologf --fmin 500 --fmax 700
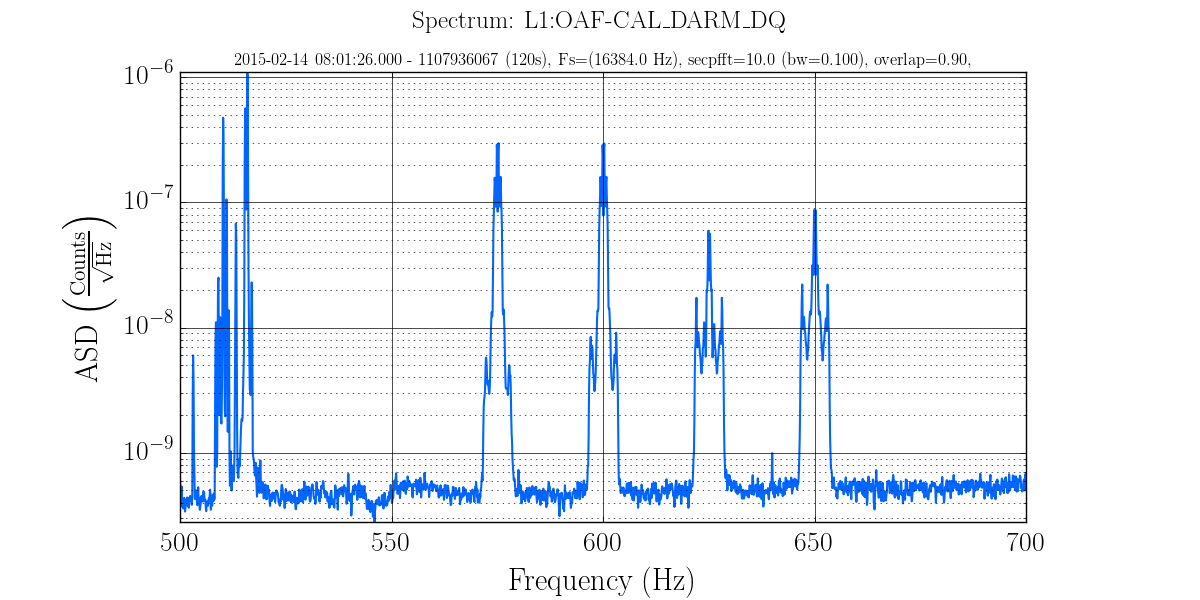
Because the question such a plot could answer is exactly where are the lines, we use a linear frequency axis. Longer FFTs and a smaller frequency range would produce more resolution.
The full help text for the Spectrum plot product is:
$ gwpy-plot spectrum --help
usage: gwpy_ldvw spectrum [-h] [-v] [-s SILENT] --chan CHAN [CHAN ...] --start
                      START [START ...] [--duration DURATION]
                      [-c FRAMECACHE] [--highpass HIGHPASS]
                      [--secpfft SECPFFT] [--overlap OVERLAP] [--nologf]
                      [--fmin FMIN] [--fmax FMAX] [--nology] [--ymin YMIN]
                      [--ymax YMAX] [-g GEOMETRY] [--interactive]
                      [--title TITLE] [--suptitle SUPTITLE]
                      [--xlabel XLABEL] [--ylabel YLABEL] [--out OUT]
                      [--legend [LEGEND [LEGEND ...]]] [--nolegend]
                      [--nogrid]

optional arguments:
  -h, --help            show this help message and exit
  -v, --verbose         increase verbose output
  -s SILENT, --silent SILENT
                        show only fatal errors
  --chan CHAN [CHAN ...]
                        One or more channel names.
  --start START [START ...]
                        Starting GPS times(required)
  --duration DURATION   Duration (seconds) [10]
  -c FRAMECACHE, --framecache FRAMECACHE
                        use .gwf files in cache not NDS2, default use NDS2
  --highpass HIGHPASS   frequency for high pass butterworth, default no filter
  --secpfft SECPFFT     length of fft in seconds for each calculation
  --overlap OVERLAP     Overlap as fraction [0-1)
  --nologf              make frequency axis linear, default=logarithmic
  --fmin FMIN           min value for frequency axis
  --fmax FMAX           max value for frequency axis
  --nology              make Y-axis linear, default=logarthmic
  --ymin YMIN           fix min value for yaxis defaults to min of data
  --ymax YMAX           max value for y-axis default to max of data
  -g GEOMETRY, --geometry GEOMETRY
                        size of resulting image WxH, default: 1200x600
  --interactive         when running from ipython allows experimentation
  --title TITLE         One or more title lines
  --suptitle SUPTITLE   1st title line (larger than the others)
  --xlabel XLABEL       x axis text
  --ylabel YLABEL       y axis text
  --out OUT             output filename, type=ext (png, pdf, jpg),
                        default=gwpy.png
  --legend [LEGEND [LEGEND ...]]
                        strings to match data files
  --nolegend            do not display legend
  --nogrid              do not display grid lines
Next