Coherence plots
The spectral coherence is a statistic that can be used to examine the relation between two signals or data sets. It is commonly used to estimate the power transfer between input and output of a linear system. If the signals are ergodic, and the system function linear, it can be used to estimate the causality between the input and output. [1]
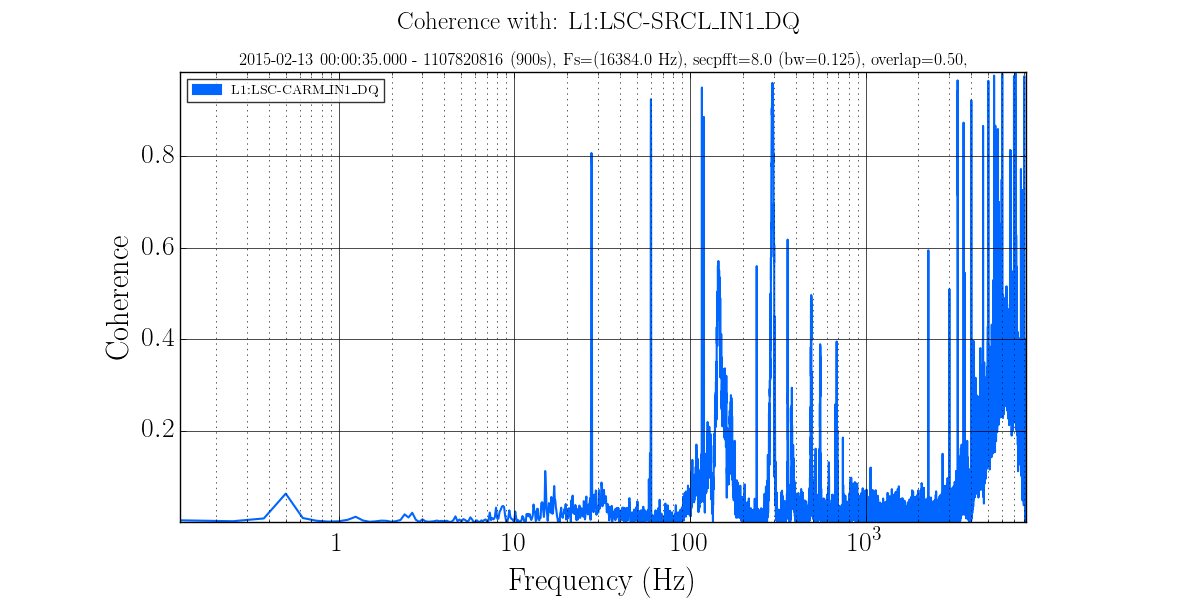
The following parameters will produce the plot below:
gwpy-plot coherence --chan L1:LSC-SRCL_IN1_DQ L1:LSC-CARM_IN1_DQ \
    --start 1107820816 --duration 900 \
    --ref L1:LSC-SRCL_IN1_DQ --secpfft 8.0 --overlap 0.50
The full list of parameters for coherence is:
$ gwpy-plot coherence --help
usage: gwpy-plot coherence [-h] [-v] [-s SILENT] --chan CHAN [CHAN ...]
                           [--ref REF] --start START [START ...]
                           [--duration DURATION] [-c FRAMECACHE]
                           [--highpass HIGHPASS] [--secpfft SECPFFT]
                           [--overlap OVERLAP] [--nologf] [--fmin FMIN]
                           [--fmax FMAX] [--logy] [--ymin YMIN] [--ymax YMAX]
                           [-g GEOMETRY] [--interactive] [--title TITLE]
                           [--suptitle SUPTITLE] [--xlabel XLABEL]
                           [--ylabel YLABEL] [--out OUT]
                           [--legend [LEGEND [LEGEND ...]]] [--nolegend]
                           [--nogrid]

optional arguments:
  -h, --help            show this help message and exit
  -v, --verbose         increase verbose output
  -s SILENT, --silent SILENT
                        show only fatal errors
  --chan CHAN [CHAN ...]
                        Two or more channels or times, first one is compared
                        to all the others
  --ref REF             Reference channel against which others will be
                        compared
  --start START [START ...]
                        Starting GPS times(required)
  --duration DURATION   Duration (seconds) [10]
  -c FRAMECACHE, --framecache FRAMECACHE
                        use .gwf files in cache not NDS2, default use NDS2
  --highpass HIGHPASS   frequency for high pass butterworth, default no filter
  --secpfft SECPFFT     length of fft in seconds for each calculation
  --overlap OVERLAP     Overlap as fraction [0-1)
  --nologf              make frequency axis linear, default=logarithmic
  --fmin FMIN           min value for frequency axis
  --fmax FMAX           max value for frequency axis
  --logy                make Y-axis logarithmic, default=linear
  --ymin YMIN           fix min value for yaxis defaults to min of data
  --ymax YMAX           max value for y-axis default to max of data
  -g GEOMETRY, --geometry GEOMETRY
                        size of resulting image WxH, default: 1200x600
  --interactive         when running from ipython allows experimentation
  --title TITLE         One or more title lines
  --suptitle SUPTITLE   1st title line (larger than the others)
  --xlabel XLABEL       x axis text
  --ylabel YLABEL       y axis text
  --out OUT             output filename, type=ext (png, pdf, jpg),
                        default=gwpy.png
  --legend [LEGEND [LEGEND ...]]
                        strings to match data files
  --nolegend            do not display legend
  --nogrid              do not display grid lines
Next
Footnotes
| [1] | See Wikipedia: http://en.wikipedia.org/wiki/Coherence_(signal_processing) |