Spectrogram
The spectrogram is a standard way to show changes in frequency distribution over time. This plot
product calculates Amplitude Spectral Density and by default, the frequency axis is on a log scale.
the time axis linear, and the intensity log. It may be
customized by changing the FFT parameters (--secpfft, --overlap), the log scale of the
Frequency axis (--nologf) and the log scale of the Intensity axes (--nologi).
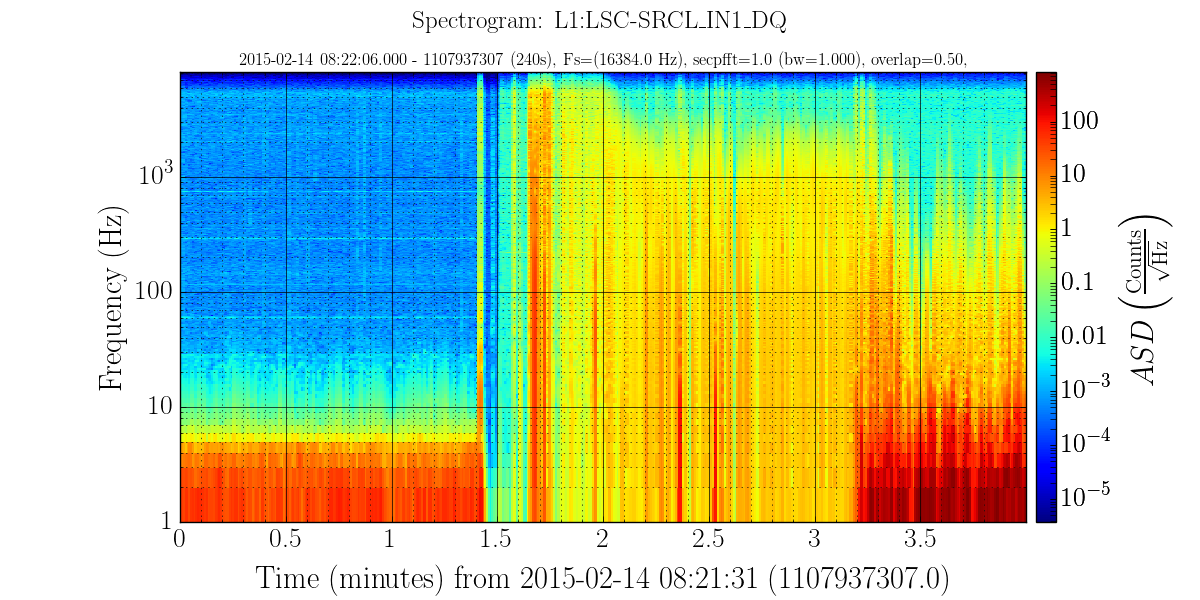
The following command line shows what happens at the end of a lock to a single channel:
gwpy-plot spectrogram --chan L1:LSC-SRCL_IN1_DQ --start 1107937307 --dur 240
The full help for the Spectrogram plot product is:
$ gwpy-plot spectrogram --help
usage: gwpy-plot spectrogram [-h] [-v] [-s SILENT] --chan CHAN [CHAN ...]
                         --start START [START ...] [--duration DURATION]
                         [-c FRAMECACHE] [--highpass HIGHPASS]
                         [--secpfft SECPFFT] [--overlap OVERLAP] [--logx]
                         [--epoch EPOCH] [--xmin XMIN] [--xmax XMAX]
                         [--nologf] [--fmin FMIN] [--fmax FMAX]
                         [--lincolors] [--imin IMIN] [--imax IMAX]
                         [--nopct] [--nocolorbar] [--norm] [-g GEOMETRY]
                         [--interactive] [--title TITLE]
                         [--suptitle SUPTITLE] [--xlabel XLABEL]
                         [--ylabel YLABEL] [--out OUT]
                         [--legend [LEGEND [LEGEND ...]]] [--nolegend]
                         [--nogrid]

optional arguments:
  -h, --help            show this help message and exit
  -v, --verbose         increase verbose output
  -s SILENT, --silent SILENT
                        show only fatal errors
  --chan CHAN [CHAN ...]
                        One or more channel names.
  --start START [START ...]
                        Starting GPS times(required)
  --duration DURATION   Duration (seconds) [10]
  -c FRAMECACHE, --framecache FRAMECACHE
                        use .gwf files in cache not NDS2, default use NDS2
  --highpass HIGHPASS   frequency for high pass butterworth, default no filter
  --secpfft SECPFFT     length of fft in seconds for each calculation
  --overlap OVERLAP     Overlap as fraction [0-1)
  --logx                make X-axis logarithmic, default=linear
  --epoch EPOCH         center X axis on this GPS time. Incompatible with logx
  --xmin XMIN           min value for X-axis
  --xmax XMAX           max value for X-axis
  --nologf              make frequency axis linear, default=logarithmic
  --fmin FMIN           min value for frequency axis
  --fmax FMAX           max value for frequency axis
  --lincolors           set intensity scale of image to linear,
                        default=logarithmic
  --imin IMIN           min pixel value in resulting image
  --imax IMAX           max pixek value in resulting image
  --nopct               up and lo are pixel values, default=percentile if not
                        normalized
  --nocolorbar          hide the color bar
  --norm                Display the ratio of each fequency bin to the mean of
                        that frequency
  -g GEOMETRY, --geometry GEOMETRY
                        size of resulting image WxH, default: 1200x600
  --interactive         when running from ipython allows experimentation
  --title TITLE         One or more title lines
  --suptitle SUPTITLE   1st title line (larger than the others)
  --xlabel XLABEL       x axis text
  --ylabel YLABEL       y axis text
  --out OUT             output filename, type=ext (png, pdf, jpg),
                        default=gwpy.png
  --legend [LEGEND [LEGEND ...]]
                        strings to match data files
  --nolegend            do not display legend
  --nogrid              do not display grid lines
Next