Coherence-spectrogram or coherencegram
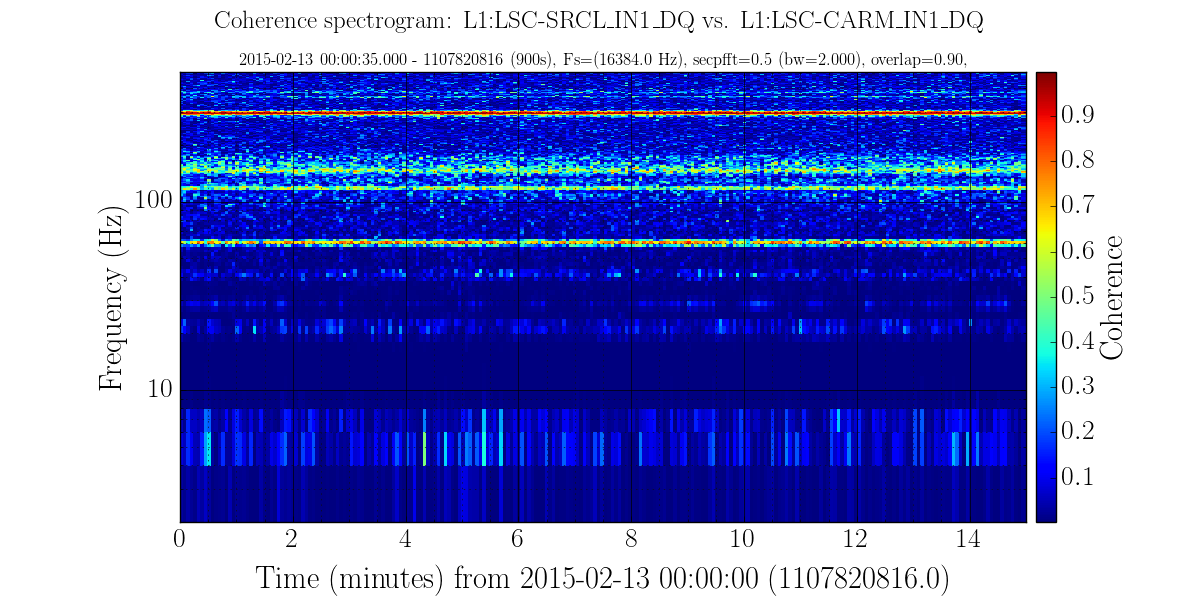
The coherence spectrogram plots multiple coherence calculations in an image similar to a spectrogram.
The parameters are similar to coherence and spectrograms with the FFTs, normalization and color bar. Two channels must be specified. The color bar is linear by default with the color range set from 0 to one.
A single coherence measurement is very noisy so the process requires at least 32 coherence calculations per column in the image. The default settings are short (0.5 second) calculations with a high (0.9) overlap. This seems to give a good balance between SNR and time resolution.
The following parameters will produce the sample image below:
gwpy-plot coherencegram --chan L1:LSC-SRCL_IN1_DQ L1:LSC-CARM_IN1_DQ \
    --start 1107820816 --duration 900 \
    --ref L1:LSC-SRCL_IN1_DQ --secpfft 0.500 --overlap 0.90
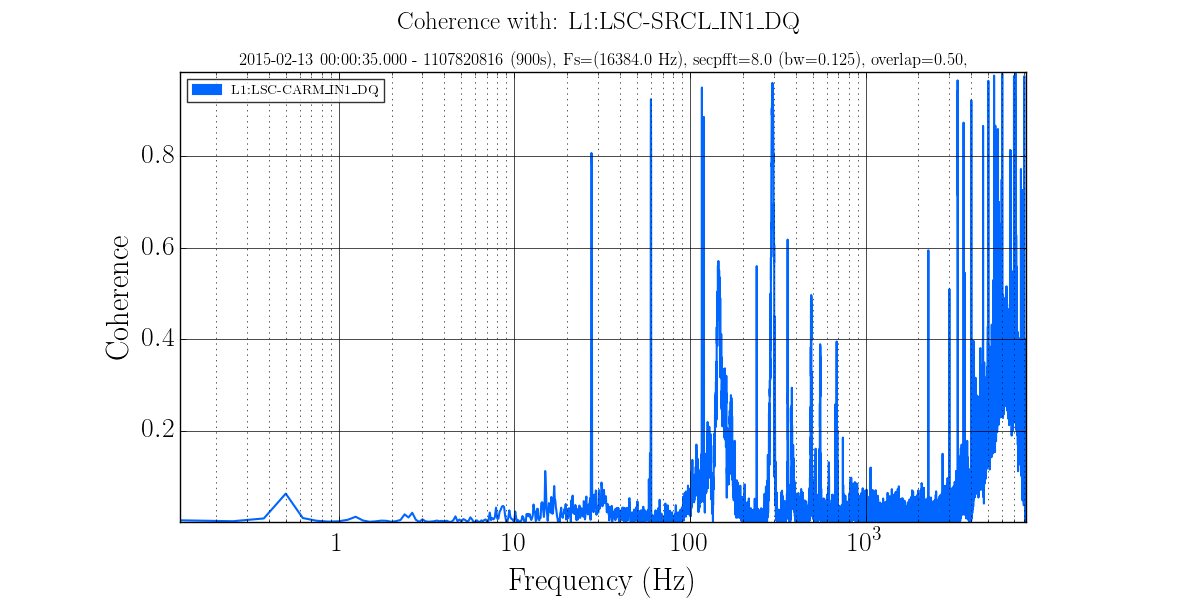
Compare that image with the line plot of coherence over the entire interval at much higher frequency resolution:
The full help text for this plot product is:
$ gwpy-plot coherencegram --help
usage: gwpy-plot coherencegram [-h] [-v] [-s SILENT] --chan CHAN [CHAN ...]
                           [--ref REF] --start START [START ...]
                           [--duration DURATION] [-c FRAMECACHE]
                           [--highpass HIGHPASS] [--secpfft SECPFFT]
                           [--overlap OVERLAP] [--logx] [--epoch EPOCH]
                           [--xmin XMIN] [--xmax XMAX] [--nologf]
                           [--fmin FMIN] [--fmax FMAX] [--logcolors]
                           [--imin IMIN] [--imax IMAX] [--nopct]
                           [--nocolorbar] [--norm] [-g GEOMETRY]
                           [--interactive] [--title TITLE]
                           [--suptitle SUPTITLE] [--xlabel XLABEL]
                           [--ylabel YLABEL] [--out OUT]
                           [--legend [LEGEND [LEGEND ...]]] [--nolegend]
                           [--nogrid]

optional arguments:
  -h, --help            show this help message and exit
  -v, --verbose         increase verbose output
  -s SILENT, --silent SILENT
                        show only fatal errors
  --chan CHAN [CHAN ...]
                        Two or more channels or times, first one is compared
                        to all the others
  --ref REF             Reference channel against which others will be
                        compared
  --start START [START ...]
                        Starting GPS times(required)
  --duration DURATION   Duration (seconds) [10]
  -c FRAMECACHE, --framecache FRAMECACHE
                        use .gwf files in cache not NDS2, default use NDS2
  --highpass HIGHPASS   frequency for high pass butterworth, default no filter
  --secpfft SECPFFT     length of fft in seconds for each calculation
  --overlap OVERLAP     Overlap as fraction [0-1)
  --logx                make X-axis logarithmic, default=linear
  --epoch EPOCH         center X axis on this GPS time. Incompatible with logx
  --xmin XMIN           min value for X-axis
  --xmax XMAX           max value for X-axis
  --nologf              make frequency axis linear, default=logarithmic
  --fmin FMIN           min value for frequency axis
  --fmax FMAX           max value for frequency axis
  --logcolors           set intensity scale of image to logarithmic,
                        default=linear
  --imin IMIN           min pixel value in resulting image
  --imax IMAX           max pixek value in resulting image
  --nopct               up and lo are pixel values, default=percentile if not
                        normalized
  --nocolorbar          hide the color bar
  --norm                Display the ratio of each fequency bin to the mean of
                        that frequency
  -g GEOMETRY, --geometry GEOMETRY
                        size of resulting image WxH, default: 1200x600
  --interactive         when running from ipython allows experimentation
  --title TITLE         One or more title lines
  --suptitle SUPTITLE   1st title line (larger than the others)
  --xlabel XLABEL       x axis text
  --ylabel YLABEL       y axis text
  --out OUT             output filename, type=ext (png, pdf, jpg),
                        default=gwpy.png
  --legend [LEGEND [LEGEND ...]]
                        strings to match data files
  --nolegend            do not display legend
  --nogrid              do not display grid lines
Next