Time series plots
The time series plots label the axes X and Y. To adjust the limits use the --xmin, xmax,
ymin, ymax. The default is to set the axes limits to show all the data. A good
reason to adjust the y-axis limits is to compare different plots. The x-axis is generally controlled
by the amount of data transferred but the data transfer is only controllable to integer second resolution.
The x-axis limits may be set in fractional seconds of arbitrary resolution. The x limits may be
specified in GPS seconds or as an offset from start time.
To produce a log-log or semi-log plot use the --logx and/or --logy parameters.
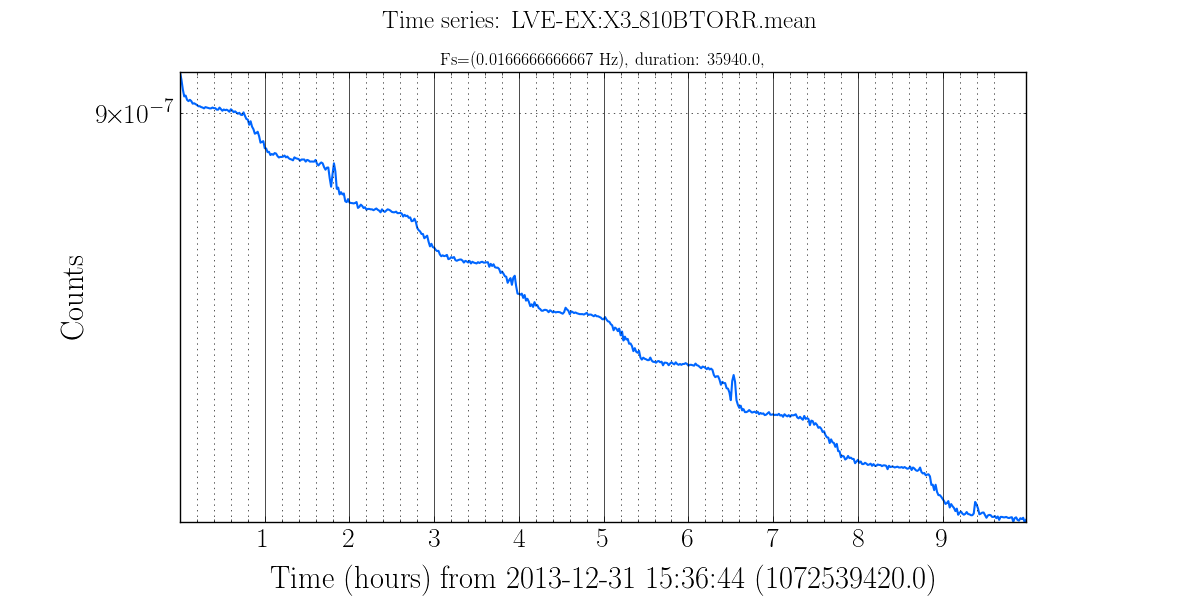
The following image is a semi-log plot of the pressure in HVEA during a pump down procedure. It shows 10 hours of the mean minute trend. Notice the syntax for that channel. It is created with the following command line
gwpy-plot timeseries --chan LVE-EX:X3_810BTORR.mean,m-trend --start 1072539420 \
    --dur 36000 --logy
The next example is a sub-second plot of a DARM channel. It is created with the following command line:
gwpy-plot timeseries --chan L1:OAF-CAL_DARM_DQ --start 1107936100 --xmin 1107936100.2 \
    --xmax 1107936100.25 --epoch 0.225 --duration 1
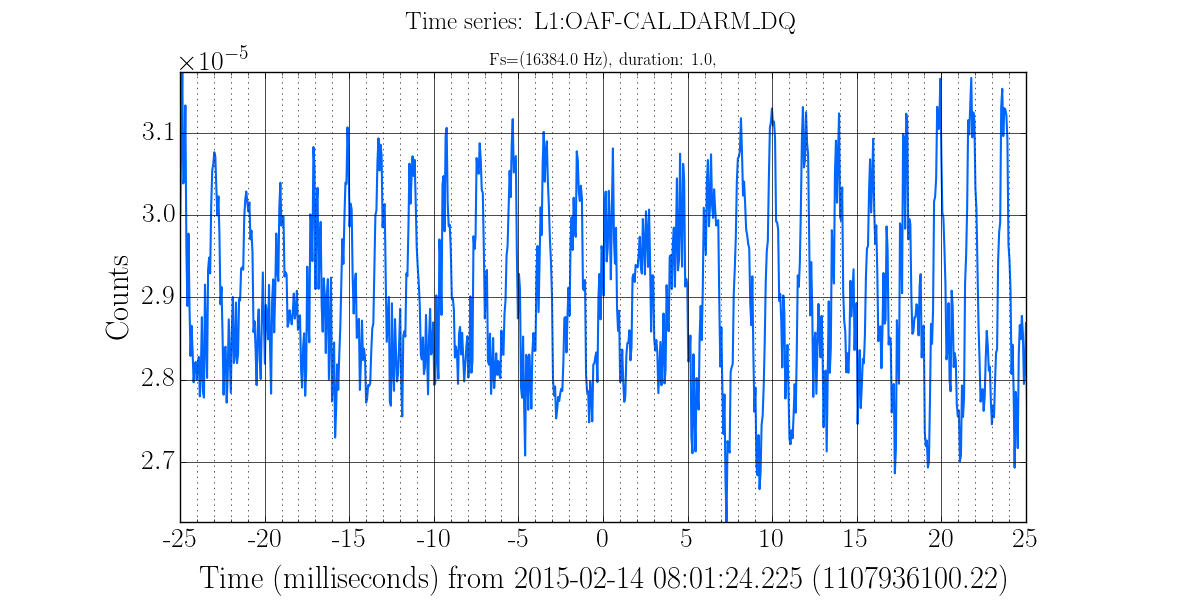
Notice the use of the --epoch parameter to set the 0 point of the time axis to the middle
of the plot.
The full help for the Time Series product is:
$ gwpy-plot timeseries --help
usage: gwpy-plot timeseries [-h] [-v] [-s SILENT] --chan CHAN [CHAN ...]
                        --start START [START ...] [--duration DURATION]
                        [-c FRAMECACHE] [--highpass HIGHPASS] [--logx]
                        [--epoch EPOCH] [--xmin XMIN] [--xmax XMAX]
                        [--logy] [--ymin YMIN] [--ymax YMAX] [-g GEOMETRY]
                        [--interactive] [--title TITLE]
                        [--suptitle SUPTITLE] [--xlabel XLABEL]
                        [--ylabel YLABEL] [--out OUT]
                        [--legend [LEGEND [LEGEND ...]]] [--nolegend]
                        [--nogrid]

optional arguments:
  -h, --help            show this help message and exit
  -v, --verbose         increase verbose output
  -s SILENT, --silent SILENT
                        show only fatal errors
  --chan CHAN [CHAN ...]
                        One or more channel names.
  --start START [START ...]
                        Starting GPS times(required)
  --duration DURATION   Duration (seconds) [10]
  -c FRAMECACHE, --framecache FRAMECACHE
                        use .gwf files in cache not NDS2, default use NDS2
  --highpass HIGHPASS   frequency for high pass butterworth, default no filter
  --logx                make X-axis logarithmic, default=linear
  --epoch EPOCH         center X axis on this GPS time. Incompatible with logx
  --xmin XMIN           min value for X-axis
  --xmax XMAX           max value for X-axis
  --logy                make Y-axis logarithmic, default=linear
  --ymin YMIN           fix min value for yaxis defaults to min of data
  --ymax YMAX           max value for y-axis default to max of data
  -g GEOMETRY, --geometry GEOMETRY
                        size of resulting image WxH, default: 1200x600
  --interactive         when running from ipython allows experimentation
  --title TITLE         One or more title lines
  --suptitle SUPTITLE   1st title line (larger than the others)
  --xlabel XLABEL       x axis text
  --ylabel YLABEL       y axis text
  --out OUT             output filename, type=ext (png, pdf, jpg),
                        default=gwpy.png
  --legend [LEGEND [LEGEND ...]]
                        strings to match data files
  --nolegend            do not display legend
  --nogrid              do not display grid lines
Next