Reading publicly-available GW data
The LIGO and Virgo scientific collaborations have released a small number of data sets associated with important milestones in their search for gravitational waves. These data can be read about and downloaded here.
The rest of this page gives an example of how you can use GWpy to read and visualise publicly available data.
GW100916
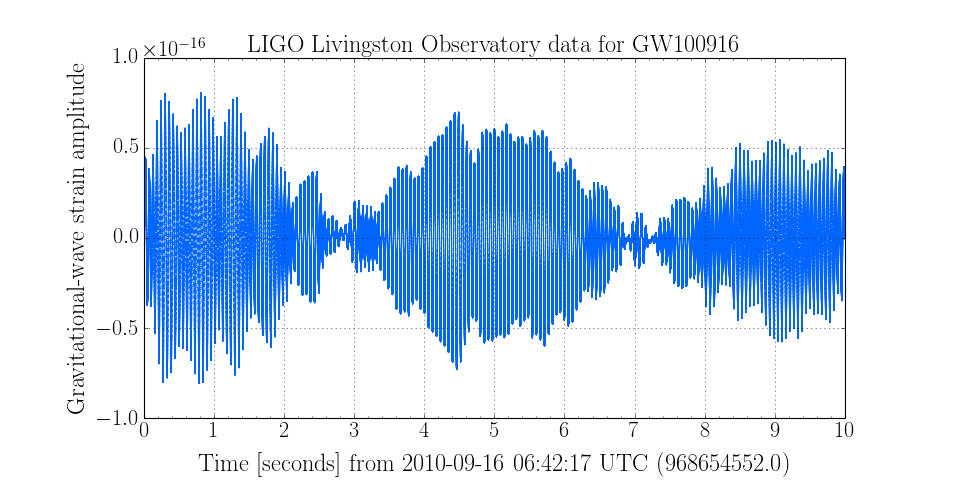
GW100916 is the designation given to an interesting event seen in the data from the detector network operating in September 2010. The gravitational-wave signal found in these data was revealed to be a ‘blind injection’, a fake signal added to the data without knowledge of the analysis teams, allowing them to test both the detector and the analysis software. The data for candidate event GW100916 are available here.
The strain time-series can be downloaded by selecting links under the ‘STRAIN DATA H(T)’ section, as txt files containing 10 seconds of data for each instrument. Anybody can download, read, and plot the data entirely in python as follows:
>>> from urllib2 import urlopen
>>> from numpy import asarray
>>> from gwpy.timeseries import TimeSeries
>>> data = urlopen('http://www.ligo.org/science/GW100916/L-strain_hp30-968654552-10.txt').read()
>>> ts = TimeSeries(asarray(data.splitlines(), dtype=float),
                    epoch=968654552, sample_rate=16384, unit='strain')
>>> plot = ts.plot()
>>> plot.set_title('LIGO Livingston Observatory data for GW100916')
>>> plot.set_ylabel('Gravitational-wave strain amplitude')
>>> plot.show()
(Source code, png)
This code is an extract from the full example on plotting public LIGO data.