Visualising filters (BodePlot)
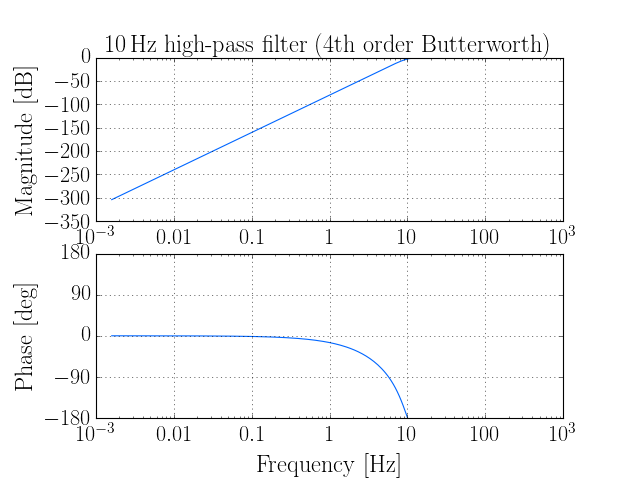
Any time-domain or Fourier-domain filters can be visualised using the Bode plot, showing the magnitude (in decibels) and phase (in degress) response of a linear time-invariant filter. The BodePlot allows for simple display of these responses for any filter, for example a 10 Hertz high-pass filter (from the Bode plot example:
(Source code, png)