Plotting a filter
I would like to look at the Bode representation of a linear filter.
First, we import the objects we need
from math import pi
from scipy import signal
from gwpy.plotter import BodePlot
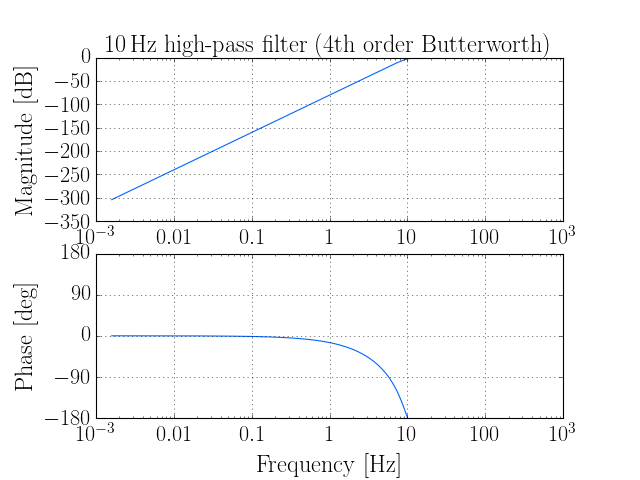
Now, we can calculate a fourth-order butterworth filter using the
butter() function
highpass = signal.butter(4, 10 * (2. * pi), btype='highpass',
                         analog=True)
The BodePlot knows how to plot filters:
plot = BodePlot(highpass)
plot.maxes.set_title('10\,Hz high-pass filter (4th order Butterworth)')
plot.show()
(Source code, png)