Plotting an event table in a scatter
I would like to study the event triggers generated by the ExcessPower gravitational-wave burst detection algorithm, over a small stretch of data.
The data from which these events were generated are a simulation of Gaussian noise with the Advanced LIGO design spectrum, and so don’t actually contain any real gravitational waves, but will help tune the algorithm to improve detection of future, real signals.
First, we import the SnglBurstTable
from gwpy.table.lsctables import SnglBurstTable
and read a set of events
events = SnglBurstTable.read('../../gwpy/tests/data/H1-LDAS_STRAIN-968654552-10.xml.gz')
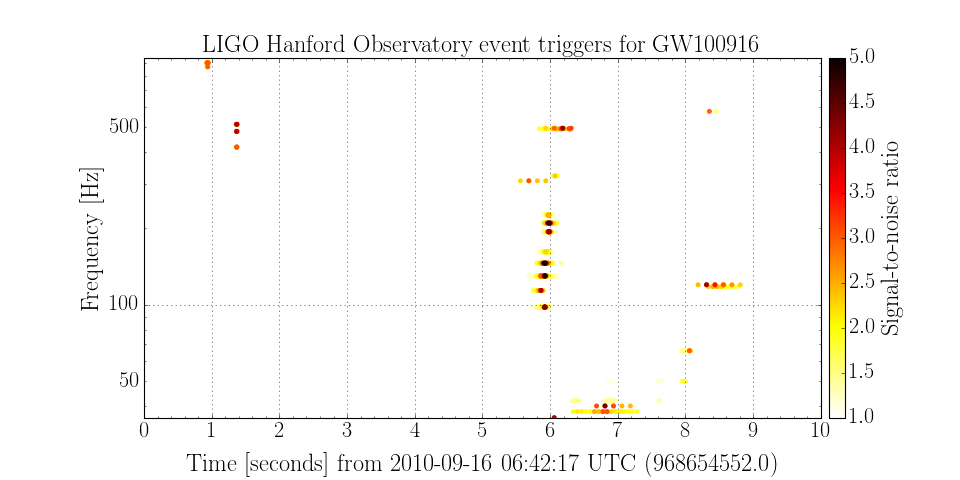
We can now make a scatter plot by specifying the x- and y-axis columns, and (optionally) the colour:
plot = events.plot('time', 'central_freq', color='snr', edgecolor='none', epoch=968654552)
plot.set_xlim(968654552, 968654552+10)
plot.set_ylabel('Frequency [Hz]')
plot.set_yscale('log')
plot.set_title('LIGO Hanford Observatory event triggers for GW100916')
plot.add_colorbar(clim=[1, 5], label='Signal-to-noise ratio', cmap='hot_r')
plot.show()
(Source code, png)