Plotting a whitened Spectrogram
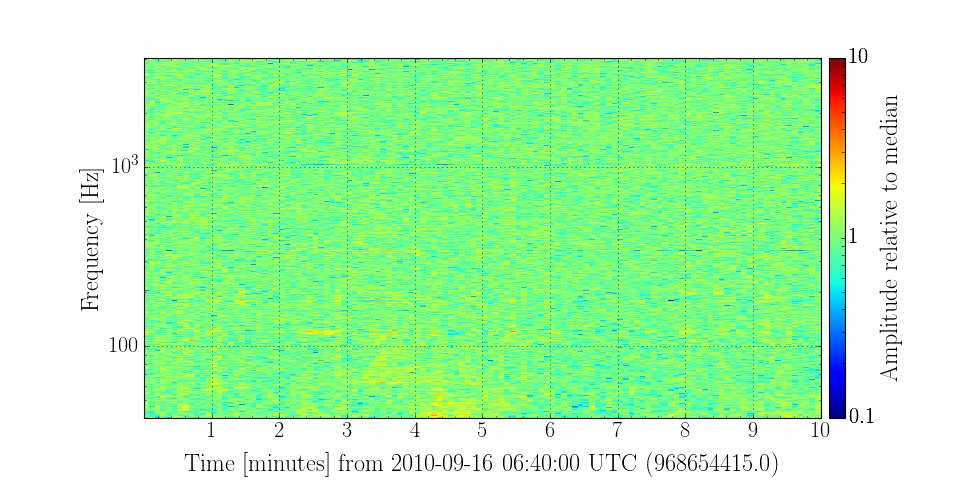
I would like to study the gravitational wave strain spectrogram around the time of an interesting simulated signal during the last science run (S6).
As with previous example, we import the
TimeSeries class,
get() the data, and calculate a
Spectrogram
from gwpy.timeseries import TimeSeries
gwdata = TimeSeries.get('H1:LDAS-STRAIN,rds', 'September 16 2010 06:40', 'September 16 2010 06:50')
specgram = gwdata.spectrogram(5, fftlength=2, overlap=1) ** (1/2.)
To whiten the specgram we can use the ratio() method
to divide by the overall median:
medratio = specgram.ratio('median')
Finally, we make a plot:
plot = medratio.plot(norm='log', vmin=0.1, vmax=10)
plot.set_yscale('log')
plot.set_ylim(40, 4096)
plot.add_colorbar(label='Amplitude relative to median')
plot.show()
(Source code, png)