Plotting a Spectrogram
I would like to study the gravitational wave strain spectrogram around the time of an interesting simulated signal during the last science run (S6).
First, we import the TimeSeries and get() the data:
from gwpy.timeseries import TimeSeries
gwdata = TimeSeries.get(
    'H1:LDAS-STRAIN', 'September 16 2010 06:40', 'September 16 2010 06:50',
    verbose=True)
Next, we can calculate a Spectrogram using the
spectrogram() method of the #
TimeSeries and a 5-second stride with a 2-second FFT and
1-second overlap (50%):
specgram = gwdata.spectrogram(5, fftlength=2, overlap=1) ** (1/2.)
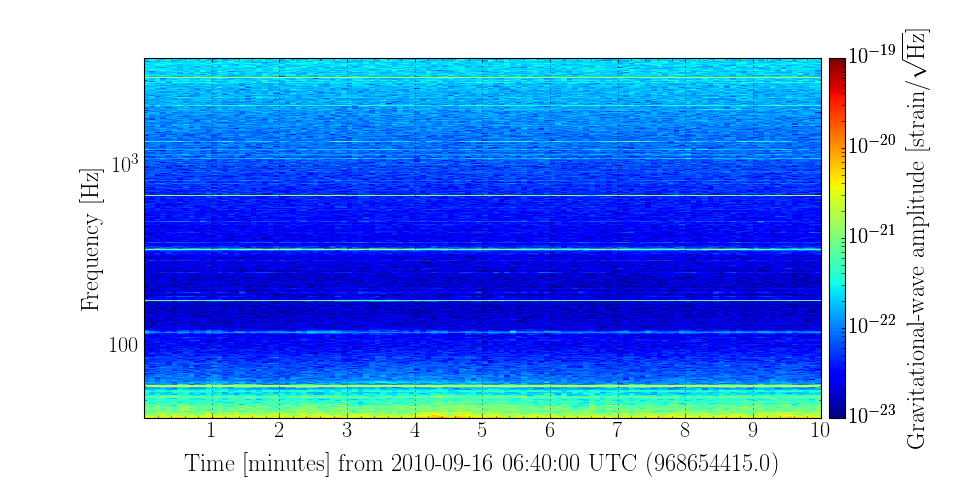
and can make a plot using the plot() method
plot = specgram.plot(norm='log', vmin=1e-23, vmax=1e-19)
plot.set_yscale('log')
plot.set_ylim(40, 4000)
plot.add_colorbar(
    label=r'Gravitational-wave amplitude [strain/$\sqrt{\mathrm{Hz}}$]')
plot.show()
(Source code, png)