Plotting a Rayleigh-statistic Spectum
First, we import the TimeSeries and get() the data:
from gwpy.timeseries import TimeSeries
gwdata = TimeSeries.get(
    'H1:LDAS-STRAIN,rds', 'September 16 2010 06:40', 'September 16 2010 06:50')
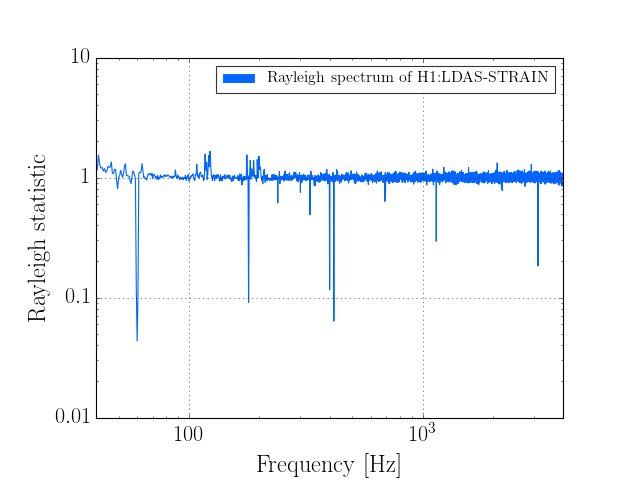
Next, we can calculate a Rayleigh statistic FrequencySeries using the
rayleigh_spectrum() method of the
TimeSeries with a 2-second FFT and 1-second overlap (50%):
rayleigh = gwdata.rayleigh_spectrum(2, 1)
and can make a plot using the plot() method
plot = rayleigh.plot()
plot.set_xscale('log')
plot.set_xlim(40, 4000)
plot.set_xlabel('Frequency [Hz]')
plot.set_ylabel('Rayleigh statistic')
plot.show()
(Source code, png)