Calculating and plotting a FrequencySeries
I’m interested in the level of ground motion surrounding a particular time during commissioning of the Advanced LIGO Livingston Observatory. I don’t have access to the frame files on disk, so I’ll need to use NDS.
In order to generate a FrequencySeries we need to import the
TimeSeries and get()
the data:
from gwpy.timeseries import TimeSeries
lho = TimeSeries.get(
    'H1:LDAS-STRAIN,rds', 'August 1 2010', 'August 1 2010 00:02')
llo = TimeSeries.get(
    'L1:LDAS-STRAIN,rds', 'August 1 2010', 'August 1 2010 00:02')
We can then call the asd() method to
calculated the amplitude spectral density for each
TimeSeries:
lhoasd = lho.asd(2, 1)
lloasd = llo.asd(2, 1)
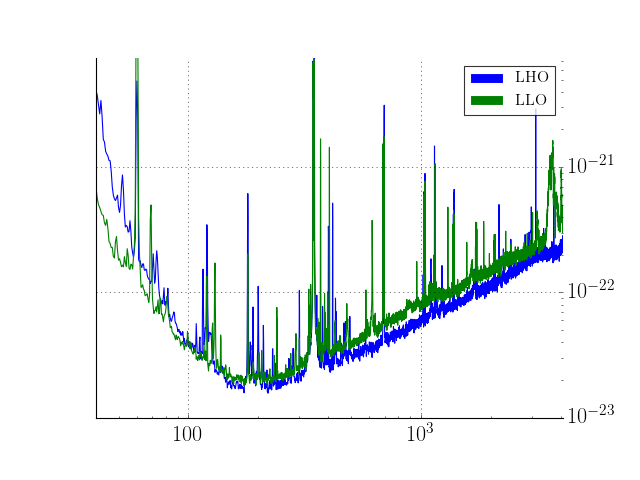
We can then plot() the spectra
plot = lhoasd.plot(color='b', label='LHO')
ax = plot.gca()
ax.plot(lloasd, color='g', label='LLO')
ax.set_xlim(40, 4096)
ax.set_ylim(1e-23, 7.5e-21)
ax.spines['right'].set_visible(False)
ax.spines['top'].set_visible(False)
ax.get_xaxis().tick_bottom()
ax.get_yaxis().tick_right()
plot.show()
(Source code, png)