Plotting tabular data
Plotting event triggers
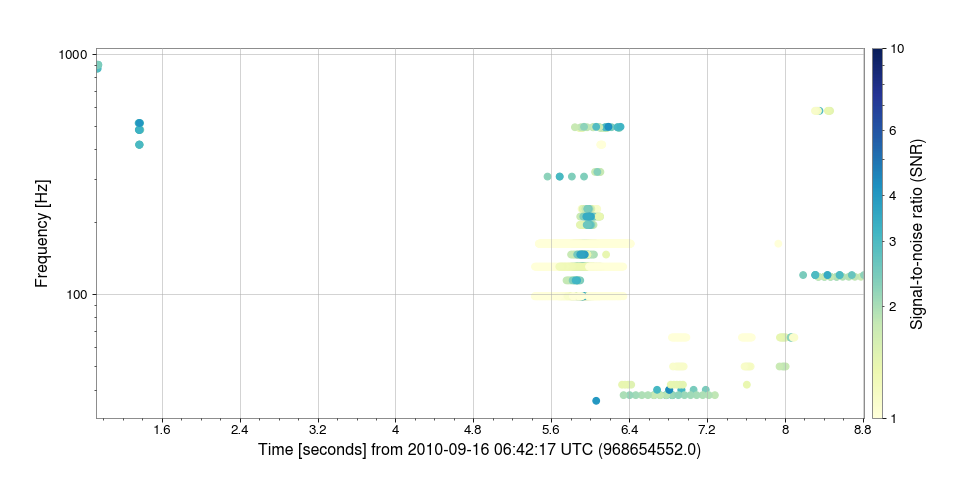
The EventTable class provides a convenience instance method to
plot() events by specifying the columns to use for the
x-axis, y-axis, and optionally colouring:
>>> from gwpy.table import EventTable
>>> events = EventTable.read('H1-LDAS_STRAIN-968654552-10.xml.gz', tablename='sngl_burst', columns=['peak', 'central_freq', 'snr'])
>>> plot = events.scatter('peak', 'central_freq', color='snr')
>>> ax = plot.gca()
>>> ax.set_epoch(968654552)
>>> ax.set_yscale('log')
>>> ax.set_ylabel('Frequency [Hz]')
>>> ax.colorbar(clim=[1, 10], cmap='YlGnBu', norm='log', label='Signal-to-noise ratio (SNR)')
(png)

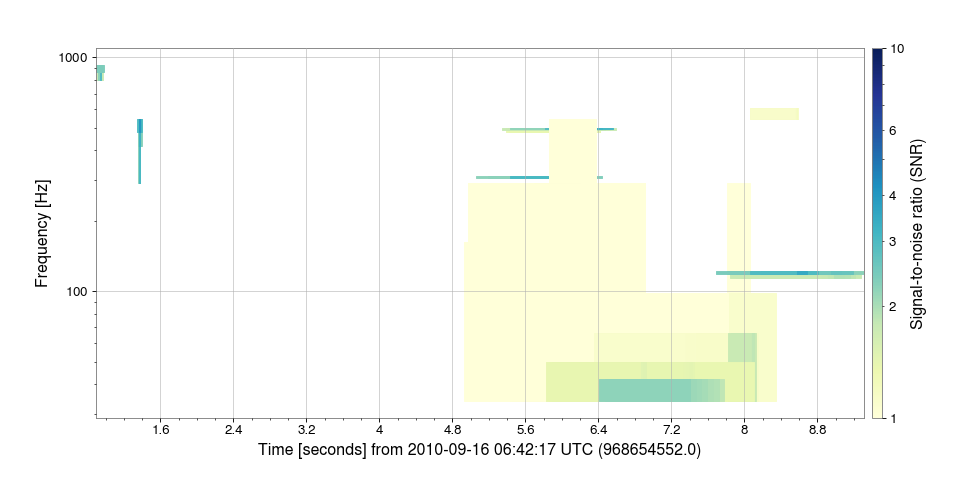
Plotting event tiles
Many types of event triggers define a 2-dimensional tile, for example in time and frequency. These tiles can be plotted in a similar manner to simple triggers.
>>> events = EventTable.read('H1-LDAS_STRAIN-968654552-10.xml.gz', tablename='sngl_burst', columns=['peak', 'central_freq', 'snr', 'duration', 'bandwidth'])
>>> plot = events.tile('peak', 'central_freq', 'duration', 'bandwidth', color='snr')
>>> ax = plot.gca()
>>> ax.set_epoch(968654552)
>>> ax.set_yscale('log')
>>> ax.set_ylabel('Frequency [Hz]')
>>> ax.colorbar(clim=[1, 10], cmap='YlGnBu', norm='log', label='Signal-to-noise ratio (SNR)')


These code snippets are part of the example Plotting an EventTable as 2-d tiles.