3. Plotting an EventTable as 2-d tiles
I would like to study the event triggers generated by the ExcessPower gravitational-wave burst detection algorithm, over a small stretch of data.
The data from which these events were generated contain a simulated gravitational-wave signal, or hardware injection, used to validate the performance of the LIGO detectors and downstream data analysis procedures.
First, we import the EventTable object and read in a set of events from
a LIGO_LW-format XML file containing a
sngl_burst table
from gwpy.table import EventTable
events = EventTable.read(
    'H1-LDAS_STRAIN-968654552-10.xml.gz', tablename='sngl_burst',
    columns=['peak', 'central_freq', 'bandwidth', 'duration', 'snr'])
Note
Here we manually specify the columns to read in order to optimise
the read() operation to parse only the data we actually need.
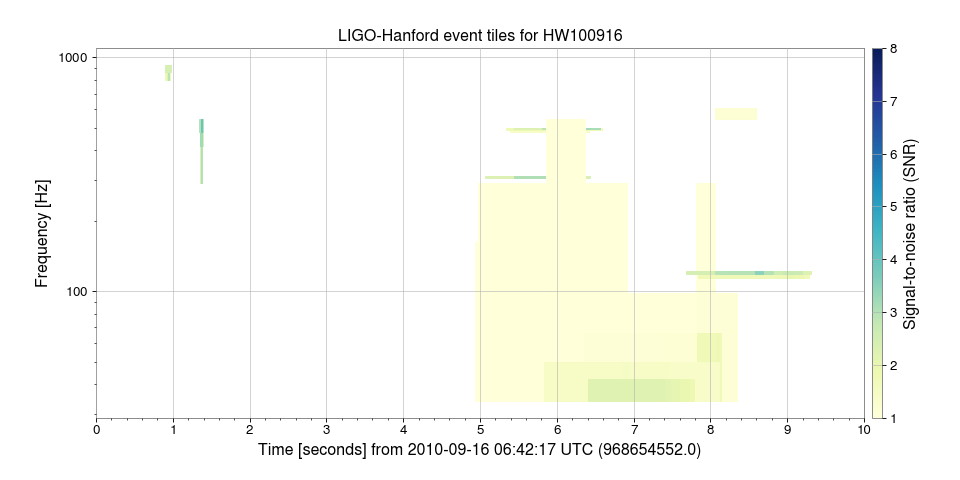
We can make a plot of these events as 2-dimensional tiles by specifying the x- and y-axis columns, and the widths in those directions:
plot = events.tile('peak', 'central_freq', 'duration', 'bandwidth',
                   color='snr')
ax = plot.gca()
ax.set_yscale('log')
ax.set_ylabel('Frequency [Hz]')
ax.set_epoch(968654552)
ax.set_xlim(968654552, 968654552+10)
ax.set_title('LIGO-Hanford event tiles for HW100916')
ax.colorbar(clim=[1, 8], cmap='YlGnBu', label='Signal-to-noise ratio (SNR)')
plot.show()
(png)
