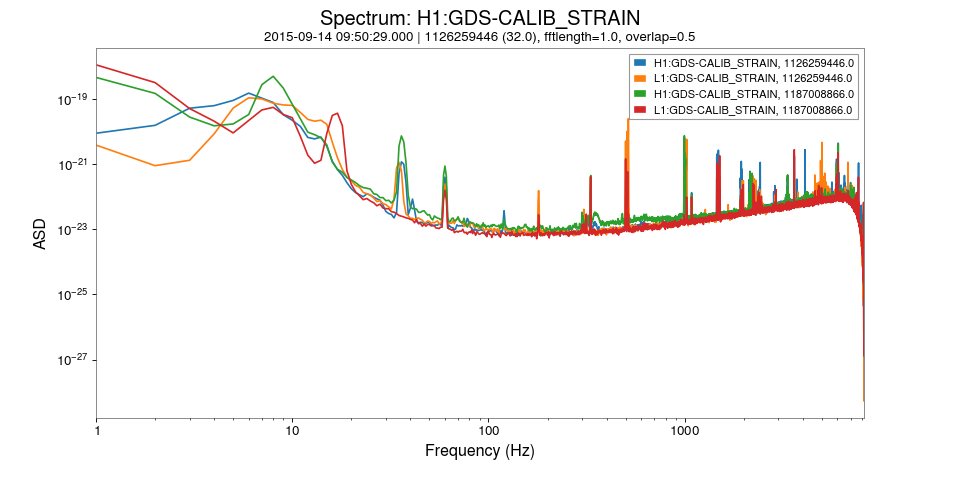
5. Spectrum at two times
This example plots the spectrum (power spectral density) of strain data from both LIGO-Hanford and LIGO-Livingston for two different GPS times (around GW150914 and GW170817).
gwpy-plot spectrum \
    --chan H1:GDS-CALIB_STRAIN L1:GDS-CALIB_STRAIN \
    --start 1126259446 \
    --start 1187008866 \
    --duration 32 \
    --interactive
(png)
