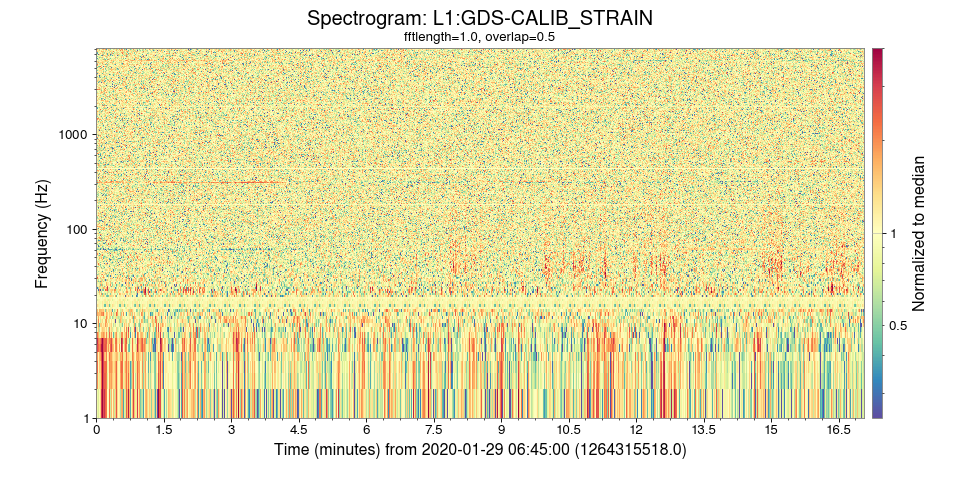
9. Normalised spectrogram
This example shows a normalised spectrogram of the strain data from LIGO-Hanford around the time of GW150914.
gwpy-plot spectrogram \
    --chan L1:GDS-CALIB_STRAIN \
    --start 1264315518 \
    --duration 1024 \
    --norm \
    --cmap Spectral_r \
    --imin .25 \
    --imax 4 \
    --interactive
(png)