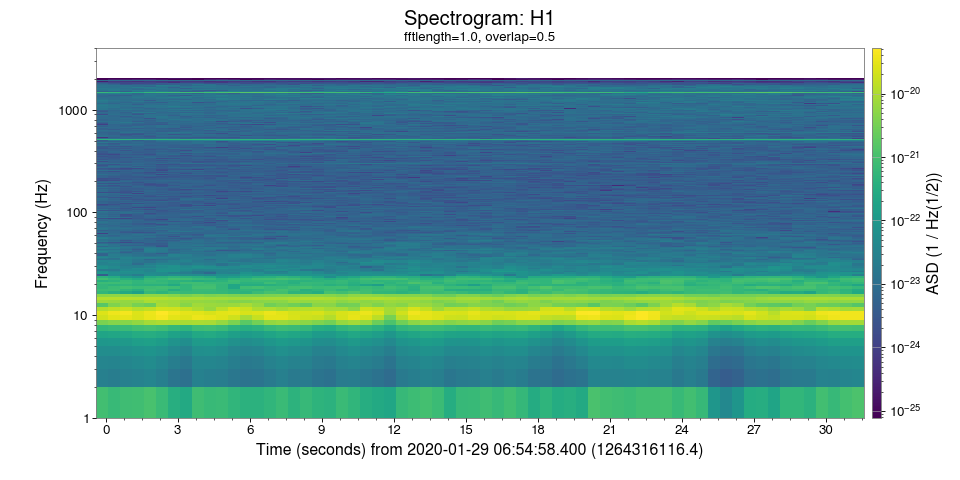
8. Simple spectrogram
This example shows a spectrogram of the strain data from LIGO-Hanford around the time of GW150914.
gwpy-plot spectrogram \
    --gwosc \
    --ifo H1 \
    --start 1264316116 \
    --duration 32 \
    --epoch 1264316116.4 \
    --ymax 4000 \
    --interactive
(png)