11. Simple coherence spectrogram
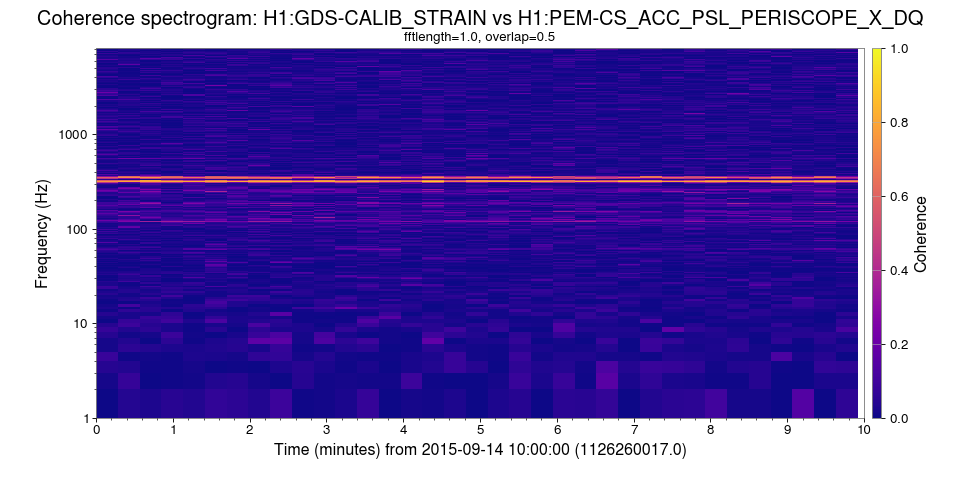
This example shows the time-variation spectrogram
of the estimated coherence between the strain data for
LIGO-Hanford (H1:GDS-CALIB_STRAIN) and the motion of an optical
periscope used to direct the main laser beam into the Hanford
interferometer.
gwpy-plot coherencegram \
    --chan H1:GDS-CALIB_STRAIN H1:PEM-CS_ACC_PSL_PERISCOPE_X_DQ \
    --start 1126260017 \
    --duration 600 \
    --interactive
(png)