Calculating event trigger rate
Simple event rate
For discrete data in the form of event triggers, it is often very
illuminating to analyse the rate at which these events occur in time -
usually a high event rate is indicative of a higher noise level.
One can calculate the event rate of an EventTable via the
event_rate() method:.
-
EventTable.event_rate(stride, start=None, end=None, timecolumn='time')[source] Calculate the rate
TimeSeriesfor thisTable.Parameters: stride :
floatsize (seconds) of each time bin
start :
float,LIGOTimeGPS, optionalGPS start epoch of rate
TimeSeriesend :
float,LIGOTimeGPS, optionalGPS end time of rate
TimeSeries. This value will be rounded up to the nearest sample if needed.timecolumn :
str, optional, default:timename of time-column to use when binning events
Returns: rate :
TimeSeriesa
TimeSeriesof events per second (Hz)
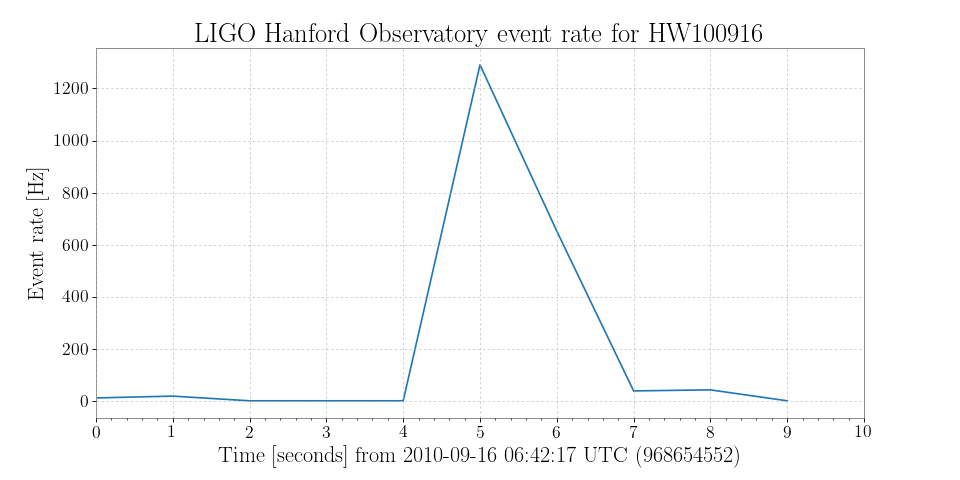
For example, using the same data as before we can calculate and plot the event rate on a 1-second stride:
>>> from gwpy.table import EventTable
>>> events = EventTable.read('H1-LDAS_STRAIN-968654552-10.xml.gz', tablename='sngl_burst', columns=['peak', 'central_freq', 'snr'])
>>> rate = events.event_rate(1, start=968654552, end=968654562, timecolumn='peak')
>>> plot = rate.plot()
>>> ax = plot.gca()
>>> ax.set_ylabel('Event rate [Hz]')
>>> ax.set_title('LIGO Hanford Observatory event rate for HW100916')
>>> plot.show()
(png)
This code is a snippet of the example Calculating (and plotting) rate versus time for an EventTable.
Binned event rate
Following from a simple rate versus time calculation, it is often useful
to calculate the event rate for multiple conditions on the same table.
For this, we can use the binned_event_rates() method:
-
EventTable.binned_event_rates(stride, column, bins, operator='>=', start=None, end=None, timecolumn='time')[source] Calculate an event rate
TimeSeriesDictover a number of bins.Parameters: stride :
floatsize (seconds) of each time bin
column :
strname of column by which to bin.
bins :
listone of:
'<','<=','>','>=','==','!=', for a standard mathematical operation,'in'to use the list of bins as containing bin edges, or- a callable function that takes compares an event value against the bin value and returns a boolean.
Note
If
binsis given as a list of tuples, this argument is ignored.start :
float,LIGOTimeGPS, optionalGPS start epoch of rate
TimeSeries.end :
float,LIGOTimeGPS, optionalGPS end time of rate
TimeSeries. This value will be rounded up to the nearest sample if needed.timecolumn :
str, optional, default:timename of time-column to use when binning events
Returns: rates : ~gwpy.timeseries.TimeSeriesDict`
a dict of (bin,
TimeSeries) pairs describing a rate of events per second (Hz) for each of the bins.
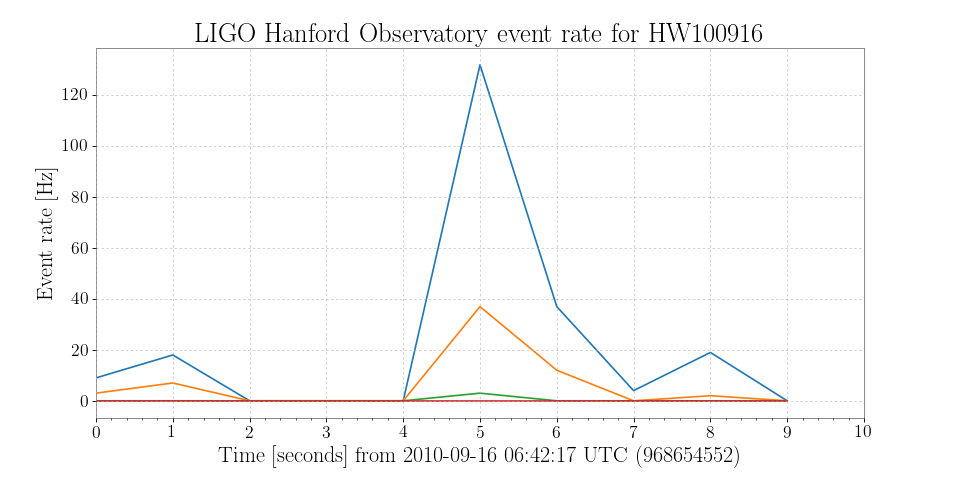
For example, in the following example, we calculate the rate of events with signal-to-noise ratio (SNR) above some threshold, for the same table as above.
>>> rates = events.binned_event_rates(1, 'snr', [2, 3, 5, 8], operator='>=', start=968654552, end=968654562, timecolumn='peak')
>>> plot = rates.plot()
>>> ax = plot.gca()
>>> ax.set_ylabel('Event rate [Hz]')
>>> ax.set_title('LIGO Hanford Observatory event rate for HW100916')
>>> plot.show()
(png)
This code is a snippet of the example on Plotting EventTable rate versus time for specific column bins.