Data table histograms
The EventTable object comes with a hist() method, allowing
trivial generation of histograms using any column as the counter:
-
EventTable.hist(column, **kwargs)[source] Generate a
HistogramPlotof thisTable.Parameters: column :
strname of the column over which to histogram data
**kwargs
any other arguments applicable to the
HistogramPlotReturns: plot :
HistogramPlotnew plot displaying a histogram of this
Table.
Using the above method we can generate a histogram as follows
>>> from gwpy.table import EventTable
>>> events = EventTable.read('H1-LDAS_STRAIN-968654552-10.xml.gz', tablename='sngl_burst', columns=['snr'])
>>> plot = events.hist('snr', weights=1/10., logbins=True, bins=50, histtype='stepfilled')
>>> ax = plot.gca()
>>> ax.set_xlabel('Signal-to-noise ratio (SNR)')
>>> ax.set_ylabel('Rate [Hz]')
>>> ax.set_title('LHO event triggers for HW100916')
>>> ax.autoscale(axis='x', tight=True)
>>> plot.show()
(png)
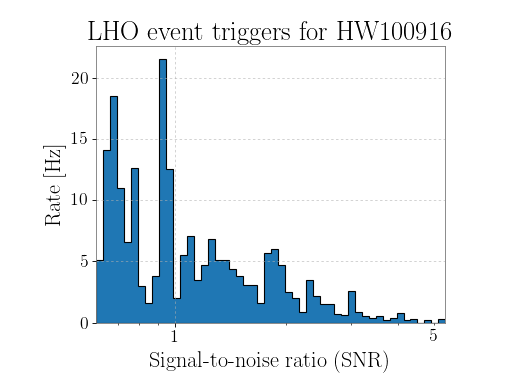
This is a snippet from the example Plotting an EventTable in a histogram.