2. Plotting an EventTable in a histogram
I would like to study the snr distribution of event triggers generated by the ExcessPower gravitational-wave burst detection algorithm, over a small stretch of data.
The data from which these events were generated contain a simulated gravitational-wave signal, or hardware injection, used to validate the performance of the LIGO detectors and downstream data analysis procedures.
First, we import the EventTable object and read in a set of events from
a LIGO_LW-format XML file containing a
sngl_burst table
from gwpy.table import EventTable
events = EventTable.read(
    'H1-LDAS_STRAIN-968654552-10.xml.gz', tablename='sngl_burst',
    columns=['time', 'snr'])
Note
Here we manually specify the columns to read in order to optimise
the read() operation to parse only the data we actually need.
and can generate a new HistogramPlot using the
hist() instance method using weights=1/10.
to convert the counts from the histogram into a rate in Hertz
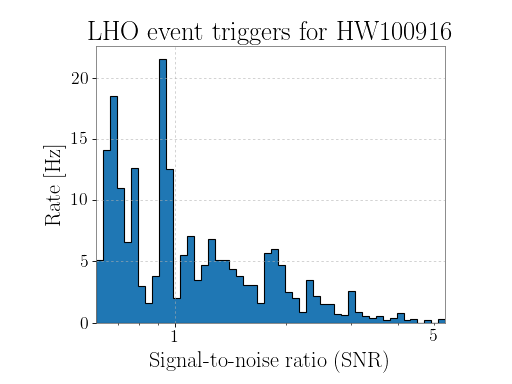
plot = events.hist('snr', weights=1/10., logbins=True,
                   bins=50, histtype='stepfilled')
ax = plot.gca()
ax.set_xlabel('Signal-to-noise ratio (SNR)')
ax.set_ylabel('Rate [Hz]')
ax.set_title('LHO event triggers for HW100916')
ax.autoscale(axis='x', tight=True)
plot.show()
(png)