Plotting an over-dense, short-duration Spectrogram
The normal spectrogram method uses non-overlapping intervals
to calculate discrete PSDs for each stride. This is fine for long-duration
data, but give poor resolution when studying short-duration phenomena.
The spectrogram2 method allows for highly-overlapping FFT
calculations to over-sample the frequency content of the input TimeSeries
to produce a much more feature-rich output.
As with the other Spectrogram examples, we import the
TimeSeries class, and get() the data, but in this
example we only need 5 seconds of datam,
from gwpy.timeseries import TimeSeries
gwdata = TimeSeries.get(
    'L1:OAF-CAL_DARM_DQ', 'Feb 28 2015 06:02:05', 'Feb 28 2015 06:02:10')
Now we can call the spectrogram2 method of gwdata to
calculate our over-dense Spectrogram
specgram = gwdata.spectrogram2(fftlength=0.15, overlap=0.14) ** (1/2.)
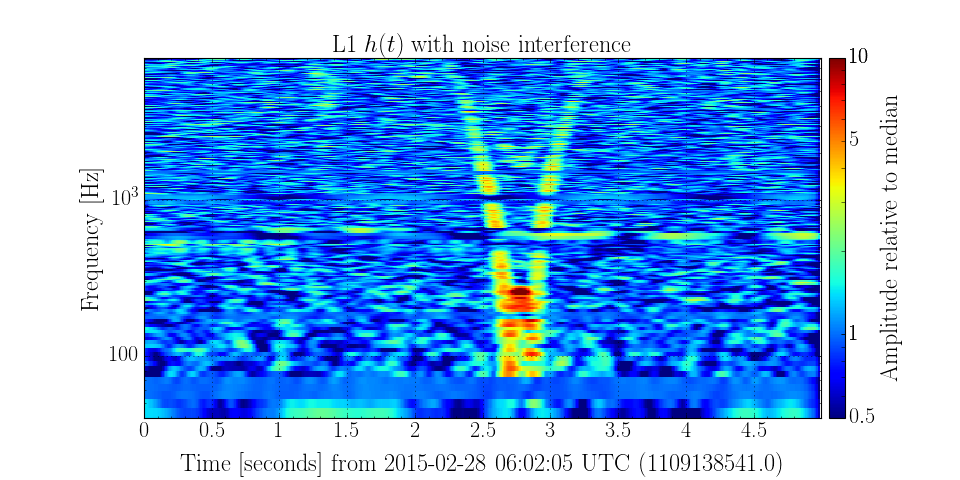
To whiten the specgram we can use the ratio() method
to divide by the overall median:
medratio = specgram.ratio('median')
Finally, we make a plot:
plot = medratio.plot(norm='log', vmin=0.5, vmax=10)
plot.set_yscale('log')
plot.set_ylim(40, 8192)
plot.add_colorbar(label='Amplitude relative to median')
plot.set_title('L1 $h(t)$ with noise interference')
plot.show()
(Source code, png)