Calculating and plotting a SpectralVariance histogram
In order to generate a SpectralVariance histogram we need to import the
TimeSeries and get()
the data:
from gwpy.timeseries import TimeSeries
llo = TimeSeries.get(
    'L1:LDAS-STRAIN,rds', 'August 1 2010', 'August 1 2010 00:10')
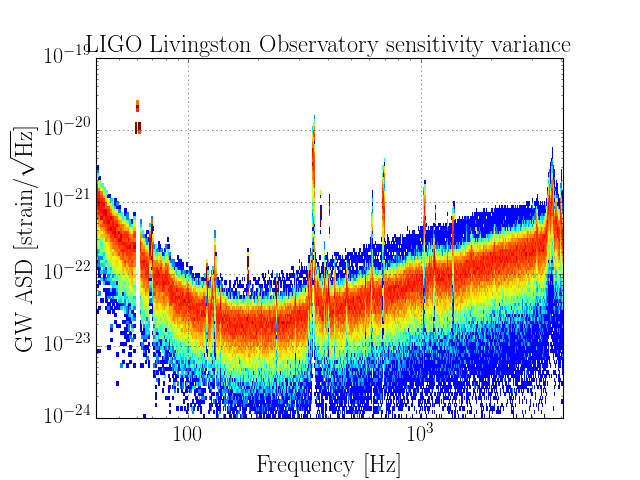
We can then call the spectral_variance()
method of the llo TimeSeries:
variance = llo.spectral_variance(1, log=True, low=1e-24, high=1e-19, nbins=100)
We can then plot() the SpectralVariance
plot = variance.plot(norm='log', vmin=0.5, vmax=100)
ax = plot.gca()
ax.grid()
ax.set_xlim(40, 4096)
ax.set_ylim(1e-24, 1e-19)
ax.set_xlabel('Frequency [Hz]')
ax.set_ylabel(r'GW ASD [strain/\rtHz]')
ax.set_title('LIGO Livingston Observatory sensitivity variance')
plot.show()
(Source code, png)