Plotting GPS time scales
As we have seen, the default matplotlib representation of GPS scales
is not great, given the large zero-offset typically seen with 21st century GPS
times.
To improve displays of data with GPS timestamps, GWpy provides a number of
custom scales.
Each scale uses an epoch and a unit to recentre and format the GPS
axis in a way that clearly displays the data, without large offsets or
multipliers.
'auto-gps'
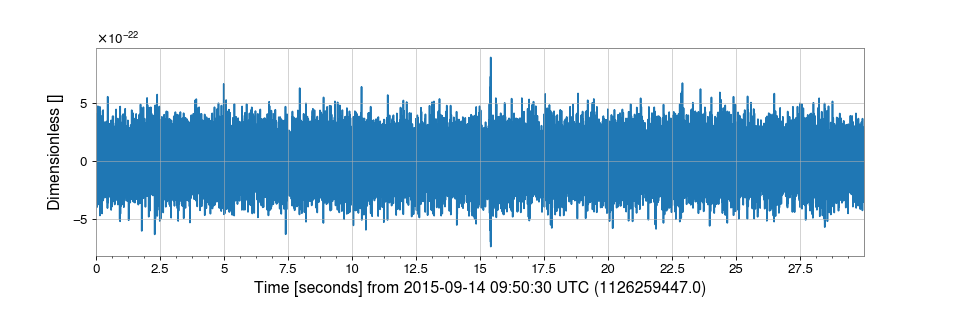
The 'auto-gps' scale (the default for most GPS-based plots) automatically
calculates an epoch and unit each time the figure is drawn, based on
the current view limits and data limits:
>>> from gwpy.timeseries import TimeSeries
>>> raw = TimeSeries.fetch_open_data('L1', 1126259446, 1126259478)
>>> data = raw.bandpass(50, 300).notch(60).crop(*raw.span.contract(1))
>>> plot = data.plot(xscale='auto-gps')
>>> plot.show()
(png)

Here the default epoch is just the epoch for the given TimeSeries, and the
unit has been automatically chosen as 'seconds'.
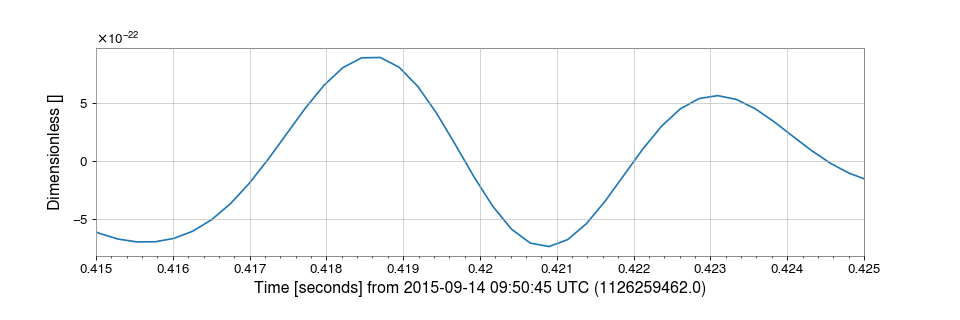
However, if we zoom the axes to a tiny fraction of a second, the unit is
automatically reselected to something more sensible:
>>> ax = plot.gca()
>>> ax.set_xlim(1126259462.415, 1126259462.425)
>>> plot.refresh()
(png)

Fixed units
A GPS axis can be fixed to a specific unit via the
set_xscale() (or
set_yscale()) method of the relevant axis.
The available units are
'nanoseconds''microseconds''milliseconds''seconds''minutes''hours''days''weeks''years'
>>> ax.set_xscale('seconds')
>>> plot.refresh()
(png)

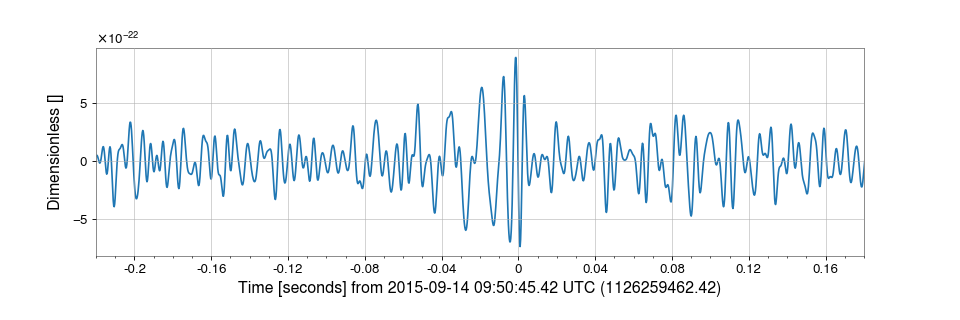
Fixed epoch
A GPS axis can be fixed to a specific epoch via the same
set_xscale() (or
set_yscale()) method of the relevant axis, or
via the special set_epoch() method:
>>> ax.set_xlim(1126259462.2, 1126259462.6)
>>> ax.set_epoch(1126259462.42)
>>> plot.refresh()
(png)
Note
A fixed epoch can be used with 'auto-gps' as well as any of the
fixed units.