1. Plotting observing segments for O1
The data from the full Observing Run 1 (O1) have been released by GWOSC.
This example demonstrates how to download segment information into a
DataQualityFlag, and then plot them.
All we need to do is import the DataQualityFlag object, and then call
the DataQualityFlag.fetch_open_data() method to query for, and download
the segments for all of O1:
from gwpy.segments import DataQualityFlag
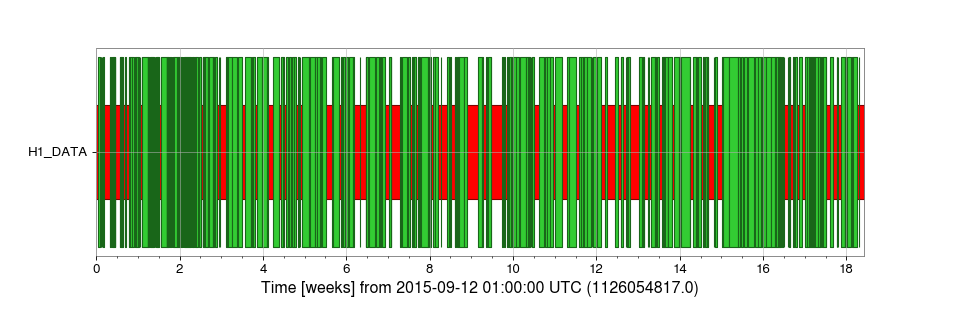
h1segs = DataQualityFlag.fetch_open_data('H1_DATA', 'Sep 12 2015',
'Jan 19 2016')
We can then generate a plot of the times when LIGO-Hanford was operating:
plot = h1segs.plot(color='gwpy:ligo-hanford')
plot.show()
(png)

That’s a lot of segments. We can pare-down the list a little to display only the segments from the first month of the run:
h1month1 = DataQualityFlag.fetch_open_data('H1_DATA', 'Sep 12 2015',
                                           'Oct 12 2015')
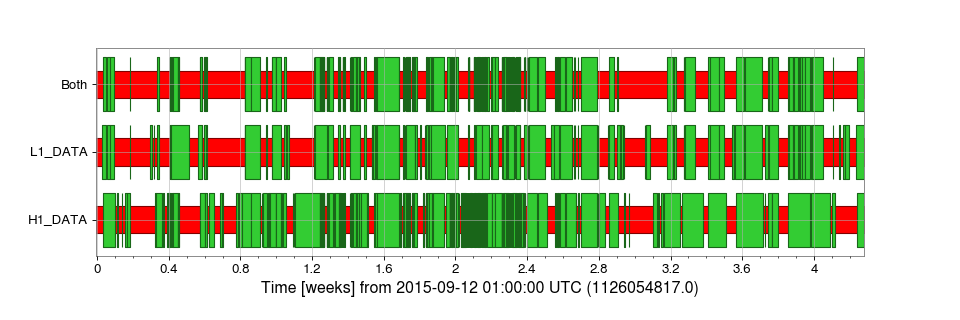
We can also download the LIGO-Livingston segments from the same period
and display them alongside, as well as those segments during which both
interferometers were operating at the same time
(see Intersection (&) for more details on this use of the
& operator):
l1month1 = DataQualityFlag.fetch_open_data('L1_DATA', 'Sep 12 2015',
                                           'Oct 12 2015')
bothon = h1month1 & l1month1
plot = h1month1.plot()
ax = plot.gca()
ax.plot(l1month1)
ax.plot(bothon, label='Both')
plot.show()
(png)
