GWpy Example: measuring a transfer function
Problem
I would like to study how ground motion is mitigated by the HEPI active seismic isolation system.
Solution
First up, we import everything we’re going to need:
>>> from gwpy.time import tconvert
>>> from gwpy.timeseries import TimeSeriesDict
>>> from gwpy.plotter import BodePlot
Next we can set the times and the channels we need:
>>> start = tconvert('May 27 2014 04:00')
>>> end = start + 1800
>>> gndchannel = 'L1:ISI-GND_STS_ITMY_Z_DQ'
>>> hpichannel = 'L1:HPI-ITMY_BLND_L4C_Z_IN1_DQ'
Now we can dowload the data using the TimeSeriesDict.fetch() method:
>>> data = TimeSeriesDict.fetch([gndchannel, hpichannel], start, end, verbose=True)
>>> gnd = data[gndchannel]
>>> gnd.name = 'Before HEPI (ground)'
>>> hpi = data[hpichannel]
>>> hpi.name = 'After HEPI'
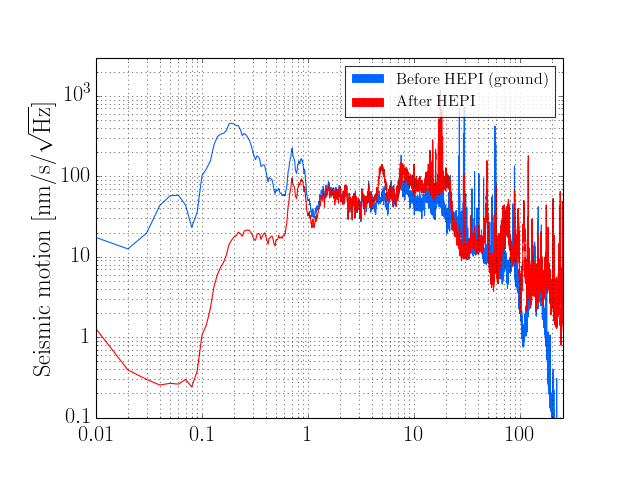
At this point it is useful to take a quick look at the amplitude spectral densities of each of the two signals:
>>> gndasd = gnd.asd(100, 50)
>>> hpiasd = hpi.asd(100, 50)
>>> asdplot = gndasd.plot()
>>> ax = asdplot.gca()
>>> ax.plot(hpiasd)
>>> ax.set_ylabel(r'Seismic motion [nm/s/$\sqrt{\mathrm{Hz}}$]')
>>> ax.set_ylim(1e-1, 3e3)
(Source code, png)
Now, in order to calculate the transfer function, we need to calculate an averaged Fourier transform of each TimeSeries. Desiring 0.01 Hz resolution, we use a 100-second FFT, with 50% overlap (specified in seconds):
>>> gndfft = gnd.average_fft(100, 50, window='hamming')
>>> hpifft = hpi.average_fft(100, 50, window='hamming')
Now we can simply calculate the transfer function by dividing the output signal (the HEPI data) by the input signal (the ground motion data), taking care because the two data channels may be recorded at different rates (meaning their FFTs will have different sizes):
>>> size = min(gndfft.size, hpifft.size)
>>> tf = hpifft[:size] / gndfft[:size]
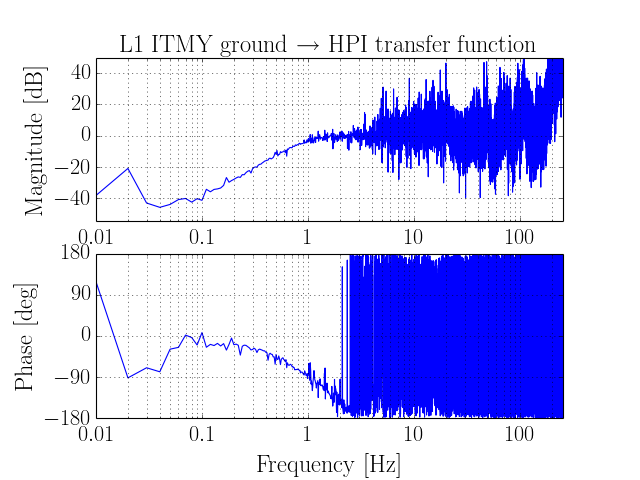
And now we can plot the result as a BodePlot:
>>> plot = BodePlot(tf)
>>> magax = plot.axes[0]
>>> magax.set_title(r'L1 ITMY ground $\rightarrow$ HPI transfer function')
>>> plot.show()
(Source code, png)