GWpy Example: plotting a TimeSeries
Problem
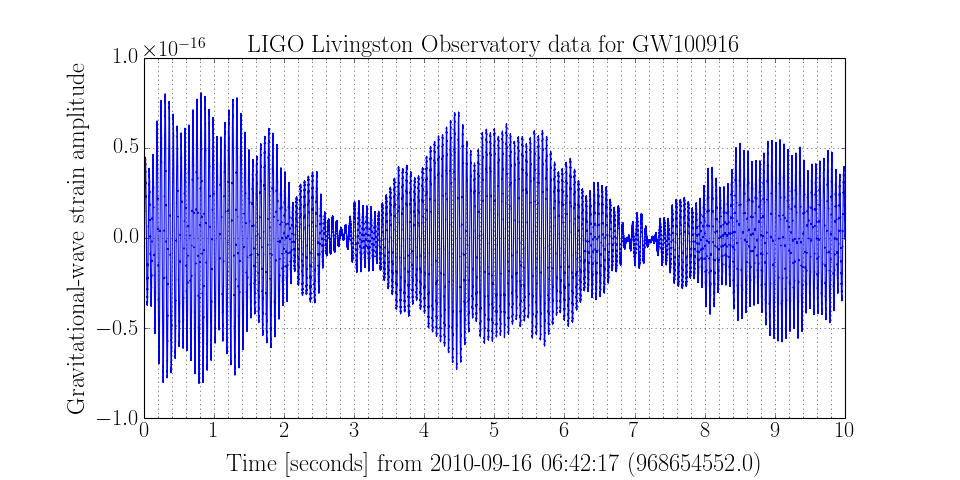
I would like to study the gravitational wave strain time-series around the time of an interesting simulated signal during the last science run (S6). For this we can use a set of data public available here.
Solution
Since the data we are interested in are public, we can download the data as follows:
>>> from urllib2 import urlopen
>>> data = urlopen('http://www.ligo.org/science/GW100916/L-strain_hp30-968654552-10.txt').read()
and can format them into a TimeSeries using numpy, and by supplying our own metadata (which is all documented on the website):
>>> from numpy import asarray
>>> from gwpy.timeseries import TimeSeries
>>> ts = TimeSeries(asarray(data.splitlines(), dtype=float), epoch=968654552, sample_rate=16384, unit='strain')
Now we can make a plot:
>>> plot = ts.plot()
>>> plot.set_title('LIGO Livingston Observatory data for GW100916')
>>> plot.set_ylabel('Gravitational-wave strain amplitude')
>>> plot.show()
(Source code, png)