GWpy Example: plotting a Spectrogram
Problem
I would like to plot a spectrogram (time-frequency-amplitude heat map) of the gravitational wave strain signal.
Solution
We can quickly fetch the data we want using the TimeSeries.fetch() method:
>>> from gwpy.timeseries import TimeSeries
>>> gwdata = TimeSeries.fetch('H1:LDAS-STRAIN', 'September 16 2010 06:40', 'September 16 2010 06:50')
>>> gwdata.unit = 'strain'
We can then generate a Spectrogram by calling the spectrogram() method of the existing TimeSeries, taking a square root to return an amplitude spectral density spectrogram, rather than a power spectral density spectrogram
>>> specgram = gwdata.spectrogram(5, fftlength=2, overlap=1) ** (1/2.)
Not we can plot it:
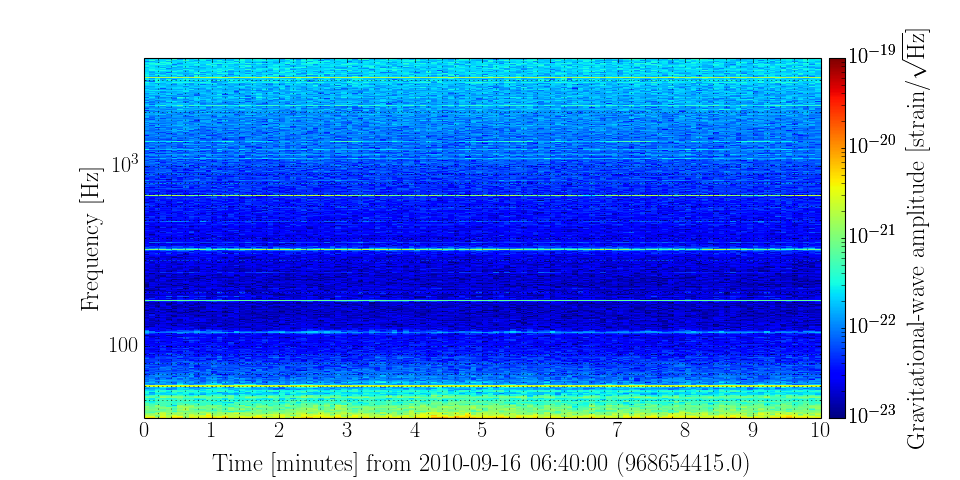
>>> plot = specgram.plot(norm='log', vmin=1e-23, vmax=1e-19)
>>> plot.set_ylim(40, 4000)
>>> plot.add_colorbar(label=r'Gravitational-wave amplitude [strain/$\sqrt{\mathrm{Hz}}$]')
>>> plot.show()
(Source code, png)