2. Compute the raw Q-transform of a TimeSeries
One of the most useful tools for visualising short-duration features in a
TimeSeries is the Q-transform.
This tool is routinely used by data analysts to produce time-frequency maps of
both transient noise (glitches) and astrophysical signals from ground-based
gravitational-wave detectors.
Below we use this algorithm to visualise GW170817, a gravitational-wave signal from two merging neutron stars. In the LIGO-Livingston (L1) detector, the end of this signal coincides with a very loud glitch (Phys. Rev. Lett. vol. 119, p. 161101).
First, we need to download the TimeSeries record of L1 strain measurements
from The Gravitational-Wave Open Science Centre (GWOSC):
from gwosc import datasets
from gwpy.timeseries import TimeSeries
gps = datasets.event_gps('GW170817')
data = TimeSeries.fetch_open_data('L1', gps-34, gps+34, tag='C00')
We can Q-transform these data and scan over time-frequency planes to find the one with the most significant tile near the time of merger:
from gwpy.segments import Segment
search = Segment(gps-0.25, gps+0.25)
qgram = data.q_gram(qrange=(4, 150), search=search, mismatch=0.35)
Note
To recover as much signal as possible, in practice we should suppress
background noise by whitening the data before the Q-transform. This
can be done with TimeSeries.whiten().
Finally, we can plot the loudest time-frequency plane, focusing on a specific window around the merger time:
from matplotlib.cm import get_cmap
cmap = get_cmap('viridis')
plot = qgram.tile('time', 'frequency', 'duration', 'bandwidth',
                  color='energy', figsize=[8, 4], linewidth=0.1,
                  edgecolor=cmap(0), antialiased=True)
ax = plot.gca()
ax.set_xscale('seconds')
ax.set_xlim(gps-6, gps+1)
ax.set_epoch(gps)
ax.set_yscale('log')
ax.set_ylim(16, 1024)
ax.set_ylabel('Frequency [Hz]')
ax.grid(True, axis='y', which='both')
ax.colorbar(cmap='viridis', label='Normalized energy', clim=[0, 25])
cmap = get_cmap('viridis')
ax.set_facecolor(cmap(0))
plot.show()
(png)
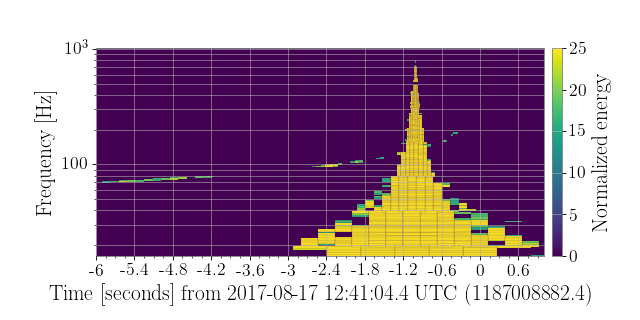
Here we can clearly see the trace of a binary neutron star merger, sweeping up in frequency through a loud saturation glitch in the foreground. For more details on this result, please see https://www.gw-openscience.org/catalog/GWTC-1-confident/single/GW170817/.