5. Plotting a transfer function
I would like to study how a signal transfers from one part of the interferometer to another.
Specifically, it is interesting to measure the amplitude transfer of ground motion through the HEPI system.
if __name__ == '__main__':
    from matplotlib import pyplot
    pyplot.ion()
Before anything else, we import the objects we will need:
from gwpy.time import tconvert
from gwpy.timeseries import TimeSeriesDict
from gwpy.plot import BodePlot
and set the times of our query, and the channels we want:
start = tconvert('May 27 2014 04:00')
end = start + 1800
gndchannel = 'L1:ISI-GND_STS_ITMY_Z_DQ'
hpichannel = 'L1:HPI-ITMY_BLND_L4C_Z_IN1_DQ'
We can call the get() method of the TimeSeriesDict
to retrieve all data in a single operation:
data = TimeSeriesDict.get([gndchannel, hpichannel], start, end, verbose=True)
gnd = data[gndchannel]
hpi = data[hpichannel]
Next, we can call the average_fft() method to calculate
an averages, complex-valued FFT for each TimeSeries:
gndfft = gnd.average_fft(100, 50, window='hamming')
hpifft = hpi.average_fft(100, 50, window='hamming')
Finally, we can divide one by the other to get the transfer function (up to the lower Nyquist)
size = min(gndfft.size, hpifft.size)
tf = hpifft[:size] / gndfft[:size]
The BodePlot knows how to separate a complex-valued
FrequencySeries into magnitude and phase:
plot = BodePlot(tf)
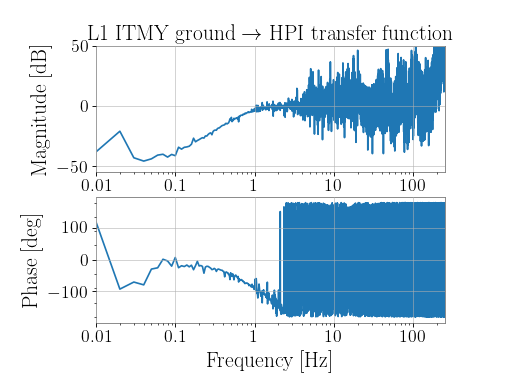
plot.maxes.set_title(
r'L1 ITMY ground $\rightarrow$ HPI transfer function')
plot.maxes.set_ylim(-55, 50)
plot.show()
(png)
